The concept of human races has often been misused, and the whole issue has therefore come under intense criticism. Though it is unlikely that there exist populations of humans that have been reproductively isolated for long enough to have diversified to the same extent as races of other biological organisms, many genetic traits do show geographical (and demographical) distributions demonstrating historical endogamical traits. When the lines separating many of these characters roughly coincide, it is useful to refer to the common borders as race divisions.
The majority (about 80%) of Indian society is broken up into about 2000 castes which can be further broken down into endogamous units which are called subcastes, the total number of these units in India is estimated to have been 75000 at its peak, and still about 43000. Any genetic study needs to take these into account, as well as the ‘gotra’s (roughly speaking, exogamous lineages) within these. A preliminary study showed that about 87% of the subcastes were strictly endogamous, and about 5% allowed ‘anuloma’ (hypergamous: woman marrying socially above herself) marriages. In almost all cases, the society is patrilocal (and patriarchal), and caste follows the father.
In addition to the Hindus who belong to the caste system, Moslems, and other established religious groups, the rest of the mainland Indian population, about 7%, is tribal in nature; 427 separate tribes are officially recognized. These are usually divided into the tribes of the Himalayan, Middle, Western and Southern India; Bengal has tribes belonging to the first two groups (1941 census: population of tribal and aborigines defined linguistically as bhoTiYA, cAkamA, dAmAi, guruM, hadi, kAmi, khAsa, kuki, lepacA, lim_bu, maMgara, meca, mru, muNDA, neoyAra, orAõ sÃotAla, sAraki, sunuoYAra, and Tip_rA: totalling in west bengal 1368780, in east bengal 287217, in Coochbehar 2435, in hilly Chattagram 233392, in Sikkim 63206, and in Tripura 33633. Note that this is not an exhaustive list by any means: khand, lusAi, gAro, hAjaM, bediYA, bAheliYA, bhŨYA, jhĩjhiYA, pAna, pAsi, dosAda, rAbhA, nATa, ghAsi, kAchAD.i, nAgesiYA, bhUmija, korA, thAru, mAlapAhAD.iYA, ho, mAhali, turi, beruYA, binda, doYAi, jimadAra, thAmbu, khAmi, khiYAM, kurmi, kaora, mAla, murami, rAYa, ToTo, shabara might also be mentioned). Knowledge of the exact affinities of the tribal with Australian or African Negrito populations would be interesting, but investigations have not been able to uncover direct genetic affinities except for known or suspected cases of recent contact. The tribes in bengal have sometimes been divided into a australasiatic like sÃotAla, ÕrAo, muNDA, etc, Chinese-mongoloid like gAro, kAchAD.i, hadi, etc., the Tibetan-mogoloid like bhoTiYA, guruM, lepcA, neoYAr, and the Arakan-burmese like cAk_mA, kuki.
The castes can roughly be broken down into the upper castes, the middle castes, and the lower castes based on their social status. The division, especially between the upper and middle castes, varies according to region. Genetic evidence points to the different social groups and geographical regions having different set of Y chromosomes, pointing to the social identity staying unchanged along male lines; similar data from mtDNA studies show only slightly higher admixture in the female lines. However, the statistical signficance of all these results is weak except to support a tribal versus caste hindu divide.
A study of the skulls from ancient South Asia showed presence of three groups of people.
In India, from anthropometric studies, one used to find traces of seven races of humans who intermixed to create the Indian race. Modern studies within regional contexts are still rare; so one mostly has to look back to the global genetic studies. Northwest India shares with west Asia and eastern Europe (and pockets in Africa and South East Asia) the maximum heterozygosity known among world populations, with means between 0.35 and 0.37; and the rest of India (and Europe) is only slightly lower: 0.33 to 0.35. This shows the vast amount of admixture that has gone on in these regions: to be contrasted against Australia which has a homozygosity of less than 0.25. It is currently accepted that at least four strata are visible in the populations in different parts of India.
Thus, for example, some researchers have concluded that the most likely synsthesis of different lines of evidence is that
The differences between different groups is small overall. But the differences that exist can be used to trace the history of human migrations. One word of caution is, however, due: human groups are rarely defined strictly genealogically. More often, it is cultural transmission that defines the groups one is studying, and this transmission has both vertical (concordant with genetics) and horizontal (possibly discordant with genetics) components. Thus a group like ‘Indoeuropeans’ is defined by cultural features (language spoken, pastural nature, milk and domestic meat based diet, importance of the domesticated horse, a certain polytheistic religion with light/dark or day/night contrast symbolism etc.) and may correlate with a certain genetic makeup. On the other hand, except for genes like lactose tolerance which probably were important for surviving with their dietary peculiarities, no other gene need correlate with this cultural pattern. It is completely possible that the Indoeuropeans in various parts of the world, or associated with migrations at different times and places, have different genetic make up. Whether that is the case for any group (like the Indoeuropeans) needs specific study.
Overall, though with those caveats, the DNA data prefers the hypothesis that the Austro-asiatic speaking tribals predate the Dravidian and the Tibeto-Burmese tribals in India (see here for one timing study). The caste populations are of more recent origins. The North-Indian muslims and the Tibeto-Burmese tribes stand apart in most comparisons (see here and here), though there is some support for a grouping of north Indian muslims and the Indo-european upper castes of the same region. The Dravidian speaking groups seem to be related by paternal lineage. A change of Dravidian tribals to Indoeuropean caste population by an ‘elite dominance’ phenomenon is consistent with the data. However, there is significant admixture of the Central Asian populations, more in the North than the South and even less in the Northeast, and more among the upper castes than among the lower.
Early mitochondrial DNA (which is maternally inherited) studies indicated that a vast number of Indian mtDNA lineages cluster with the East Asians, probably reflecting the proto-Dravidian. They also seem to be closely related to African (e.g. Ethiopian) populations, probably indicative of the Australoid-Veddoid substratum.
Modern studies indicate that the major mtDNA lineages in India belong to the typically asian M haplogroup (see here and here), whose Indian variety (T at np16223) probably originated around 48000 +/- 1500 years before present (i.e. about 46000 BC), and more than 98% of the M individuals carry this variety. This haplogroup is most common in the tribal population (for example, 96.7% amongst the Kotas of the South) and decreases as we go up in caste (reaching 18.5% amongst the Brahmins of Uttar Pradesh). It is also rare in the north Indian muslim community. Among its lineages M2 is the most diverse and occurs in significantly higher frequency among the Austro-asiatic tribals. The M3 (frequent among Dravidian tribals), M4, and M5 are also found in significant numbers. See here for relations between these.
The U haplogroup shows a contrasting distribution: it is most common among the North Indian muslim community (more than 30%), present at 15–20% in the various castes, and less than 10% among the tribals. The haplotype U2i separated from an West Eurasian lineage around 53000 +/- 4000 before present (i.e. about 51000 BC). The relative frequency of this subhaplogroup compared to the haplogroup U in general is highest amongst the tribals. Conversely, the tribals almost entirely lack the the West Eurasian subhaplogroup U2e which is more common among the upper castes and shows a caste linked gradation. The other subgroups significantly represented in Indian population are U1 and U7.
A small fraction of the Indian population (about 5–10%) belongs to lineages (W,H,K in upper castes; J,T in other castes) also common in Europe, and which have more recent divergence dates. They probably have caste linkages, but the data set is, as yet, too small to be definite. Also, the divergence times have not been estimated, so it is difficult to pinpoint which migration this refers to.
Previous research, which had not detected the caste linkage of the European haplotypes had concluded that, assuming they were largely of Western Eurasian origin (e.g. in accord with the Dravidian-protoElamite or the Indo-european hypothesis), the divergence time is about 9300 +/- 3000 BP (i.e. about 7300 BC), which is deduced as an average over various number of unknown founders (i.e. gradual migration model, rather than concentrated invasion model). Some minor geographical gradients from the Punjab to the Andhra in distribution of European haplotypes also needs further study.
The Y chromosome (which is paternally inherited) data is broadly similar, but shows higher diversity than the mtDNA data (see here). India groups clearly with the South/Southeast Asia cluster (lineage M9(xM45) or K*(xO,P)?), though North India has a large fraction of R1a(M17) as illustrated by the map (YAP = DE, M130 = O?, M89 = F, M9 = K, M45 = P, M173 = R1*(xR1a1), M17 = R1a1; F is inherently F*(xK), K is K*(xP) and P is P*(xR)) of prevalence of the markers around Eurasia.
The Central Asian P* is significantly rarer among the tribals. The European ancestral lineage BR* is more common among the tribals, especially the Dravidian tribals, than the caste populations: the lineage itself may, however, be a heterogeneous group. The Tibeto-Burmese, and to a smaller extent Austro-asiatic, tribals have higher frequencies of K*. It has been suggested that haplogroup J shows clines showing diffusion of agriculture from the middle east: Indian data does not show any clear evidence of this. The ‘Indoeuropean’ R1a and the L haplogroup are also found in significant numbers. See here for details, and here for one estimate of their ages in India. See here for data from a study concentrating mostly on the brahmins and the tribals, and here for associated age estimates.
The major European haplotype (M173 or R1b?) is pretty rare, but some European haplotypes are found amongst the upper castes, and in Punjab and Pakistan. A North African/Middle Eastern variety (M89(xM9) or F) is found at low levels all over India, but many of the Indian haplotypes seem to be of Indian origin, possibly due to genetic drift in small endogamous units.
The interesting aspect is the much stronger caste linkage in the genetic distance between the Indian and European populations found in these studies compared to those dealing with the maternally inherited mtDNA. The data also shows multiple bottleneck events showing that the ethnic subgroups of India may have formed by widespread ‘fission’ resulting from pressures on natural resources and because of social regulations.
A recent paper by Sengupta et al. has done a far more detailed study, and claims a revision of this standard scenario is in order. The much larger and varied sampling, especially of the tribals, predictably leads to much better resolution of the phylogeny and greater clarity of the haplotype distributions, sometimes correcting the details of previous analyses. Thus they find that the haplogroups H* and its subclades H1*, H1c, H1a and H2 form the most common (26.4%) haplogroup in their Indian sample followed by R1a1-M17 (15.8%), O2a-M95 (14.6%), R2-M124 (9.3%), J2-M172 (9.1%), O3e-M134 (8.0%), L1-M76 (6.3%), F*-M89 (5.2%) and others accounting for the rest 4.2%. Geographically, India lies between Pakistan (where they found R1a1-M17 which is predominant (24.4%), followed by L*-M20 (13.1%), J2-M172 (11.9%), R2-M124 (7.4%), R1b-P25 (7.4%), G-M201 (6.3%), C3-M217 (6.8%), H*-M69 (6.3%), L1-M76 (5.1%), and others, each less than 5%, accounting for the rest 16.4%) and East Asia (where O3e-M134 (15.4%), C3-M217(13.1%), N3-TAT (12.0%), O2a-M95 (10.9%), O3-M122(xO3e) (11%), N-M231(xN3) (6.3%) and R1b2-M73 (6.3%) are more than 5% and account for 75.4%). It is, however, in the study of diversity and divergence times that there are hints of disagreement with the standard model. The prevalence and diversity of H1, R1a1, and the R2 haplogroups peak in different regions. Overall, the Indoeuropean speaking groups are more similar to the Pakistani populations than to the East Asian populations, and than the Dravidian, Tibeto-Burman, and Austro-asiatic groups are to the Pakistani population. As to the origin of the haplotypes, they note that C5-M356, F*-M89, H*-M69 (including H1-M52 and H2-APT), R2-M124 and L1-M76 probably arose in India, and F*-M89 and H*-M69 may have shared demographic history. Similarly, J2a-M410 and J2b-M12 probably came through the Indus valley, whereas O2a-M95 and O3e-M134 came from SE Asia, the former probably through Orissa. A more detailed picture of the arrival of the O haplogroup in India possibly in multiple migrations from 19 Kya to 3 Kya is described in a recent paper.
The same study also finds considerable diversity in R1a1-M17 (and R2), especially in the northwest, possibly exceeding 10-15 Ka in time depth, and this has been confirmed in another study. This may be inconsistent with a single recent (i.e. about 5 Ka) entry of the comparatively recent (about 7 Ka) linguistic group called Indoeuropeans into India, though complicated exogamy rules can confound such simple conclusions. In fact, since the maximal diversity is around the Hindukush mountains, one can even postulate that as the source region, but the strong association with the Indoeuropean languages (which are unlikely to have arisen in that region), and its higher frequency (and lower diversity!) among caste Indians compared to tribals, both features confirmed in both these studies as well, points to a more complicated demographic history than the paper describes as its results. Similar remarks apply to the spread of the other haplogroups like the Dravidian and neolithic associated J. A similar conclusion is drawn by Sahoo et al. who show that the prevalence maps vary significantly between caste and tribal populations. They also conclude that there is very little to show the direction of R1a migrations: into or out of India. The data in the Sengupta et al., however, argues that no such simple scenario is likely to fit: R1a1 probably marks multiple separate population movement which still remains to be deciphered. The issue of R1a1 is, studied in much more detail in a newer paper whose conclusions I summarize in my genealogy.
The R1a1 fraction in different populations (Sengupta et al. and Qamar et al.): West Bengal Brahmins: 72%, Konkanasth Brahmins: 63%, Muslims: 58%, Sindhi Pakistani: 52/49%, Kashmiri Pakistani: 51%, Pathan Pakistani: 49%, Balti Pakistani: 46%, Tanti: 41%, Pathan Pakistan: 40/49%, UP Brahmins: 36%, Rajput: 31%, Baluchi Pakistanis: 28%. J2a is more common in India amongst the Iyengar, Iyer, and Kurumba and in Pakistan among the coastal, Sindhis, Makranis, and Baluchis. See also here for another study which broadly agrees with this.
The National Geographic site tries to assign times to these migrations as follows, the details may sometimes need to be reconciled with what would be considered habitable at the different time periods. There were two ancient migrations–haplogroup C (marker M130) that arose in Arabian region around 50000 years ago out of the M168 lineage of ‘Nonafrican Adam’ who may have lived 80000 yrs ago in the African rift valley region of Sudan or Ethiopia, and spread through the coastal regions of Southern India, Sri Lanka and further on; and haplogroup D (marker M174) which probably branched off from M168 early in Africa and accompanied them along the same coastal route (not found in mainland India, but in the Andamans). About 30000 years ago, two Indian lineages arose and populated large tracts of India for the first time–haplogroup L (marker M20) from Eurasian/American ancestor haplogroup K (marker M9) which arose around 40000 years ago from the haplogroup F (marker 89) in Central Asia; and the slightly later haplogroup H (marker M52) which arose out of an M69 lineage (called the ‘Indian’ marker, though it arose possibly in south central Asia around 30000 years ago), ultimately from the same common nonAfrican haplogroup F (marker M89) which itself had arisen out of the M168 lineage 45000 years ago. The precise relation of the haplogroup G (marker M201) which arose around 20000 years ago in the Indus region is not clear. The haplogroup O (marker M175) which arose 35000 years ago from haplogroup K (marker M9) might also have moved through eastern India. North India also has a large fraction of R1a individuals, probably associated with the Indoeuropean speakers, though one should be careful about possible caveats in genetically characterizing any cultural group. I myself belong to this lineage, and you can see its history as part of my genealogy. A different branch of the R* M207 lineage described there is the M124 R2 lineage which probably arose 25000 years ago in Central Asia and a branch of them reached India. Similarly from the M45 P lineage described there, the Q M242 lineage arose, probably in Siberia around 15 to 20 thousand years back. This is the lineage that populated the Americas, but a few clades, such as the Q6 (M346) and Q1 (M120, M265=N14), especially Q1a (M378), is found in small proportions in India and Pakistan; and in East Asia.
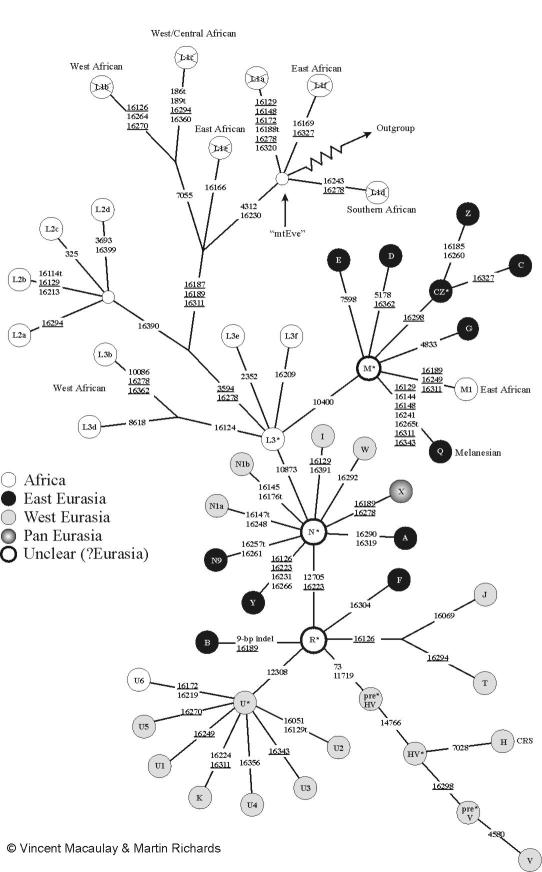
On the female side, the African haplogroup L3 originated in the same region about the same 80000 years ago, and gave rise to the haplogroup M which then spread out into Southern Asia including India, after the daughters C, D, and Z branched off. L3 also gave rise to N* in Africa. This gave rise to many of the lineages of Eurasia and Americas. In particular, the R arose somewhere in the middle east out of this group, and a few of its descendants are typical Indian. About 55000 years ago the haplogroup U arose from this somewhere in central Asia and some of its lineages are prominent in India. Haplogroup K arose 16000 years ago as a part of this and spread mainly in Europe. Haplogroups J and T arose 10000 years ago from the R, and have been associated with the spread of farming. H and V arose in Europe around 10–20000 years ago out of the preHV that arose around 40000 years ago from the R. The haplogroups A, B, F, and X are also possibly daughters of R. The haplogroups N1, I, and W are daughters of the N*.
It should be noted that the history of one or two blocks on our chromosome is not the history of the entire human populations. The difference between these is discussed briefly in my page on human evolution.
A similar caste linkage is also found in the autosomal studies: overall upper caste Indians are significantly closer to Europeans than other Indians. The autosomal locii are however inherited biparentally, so population admixture needs to be treated differently.
A new study of 25 Indian populations and a few outside ones tries to draw a picture of migrations and intermixing. Assuming a notional generation time of 25 years in this period (so the early dates are likely to be too early in this discussion), one model they find to be consistent with their data is an out of Africa scenario in which an effective population of about 9,000 individuals expanded into a 18,000 strong West African and a 5,000 individual Eurasian population some 100,000 years back. The Eurasian population then expanded into a 10,000 large Ancestral European, and a 5,000 strong Ancestral East-Eurasian populations about 50,000 years back. Within about 7500 years, this East Eurasian lineage expanded to 10,000 who gave rise to modern East Asian populations, a 3800 group of Andamanese, and about 10,000 of a group called Ancestral South Indians. The Onge among the Andamanese remained almost unmixed when the Ancestral South Indians were undergoing further mixings later, but the Great Andamanese seem to have received recent gene flow, dominantly paternal, from the mainland for a couple of generations today. The European lineage may have gotten a gene-flow from the East Asian group as late as 15,000 years back, but, the by then 20,000 strong lineage split off into the 30,000 individual Caucasian and 25,000 big West European groups about 7,000 years ago. Around 5,000 years back, a group of the West Europeans called Ancestral North Indians (ANI) started mingling with the Ancestral South Indians (ASI) to form the various Indian populations: Pathans about 80% ANI, Sindhi 75%, Kashmiri Pandit 70%, Vaish 65%, Meghawal 60%, Srivastava and Velama 55%, Tharu, Naidu, and Lodi 50%, Vysya, Kamsali, Kurumba, and Bhil 45%, to Chechu, Madiga, and Mala about 40%. They correctly caution, however, that this is only a sketch of the story: gene flows between sister groups after a split (e.g. between African and Eurasians before 50,000 years back; or between the Andamanese and the ASI before 5000 years back) is not detectable in their models and is thus consistent with mtDNA evidence that Andamanese and the tribal East Indians share a common ancestry in the last 24,000 years. Moreover, there is nothing to suggest that the mixture event that led to the Indians happened at an instant 5000 years ago: in fact, many groups seem to have small founder sizes, some as recently as a few hundred years back, others as much as a thousands of years back. Overall, caste divisions seem to be deep, with limited gene flows across caster boundaries in the historical period.
Physical anthropological studies very clearly separates the Indian populations (except some Andamanese tribals) from most of the other Asian populations, with people from the persian gulf, Arabia, Burma, SW China, Vietnamese and Malayan forming the border along the first principle coordinate. This component seems to be highly correlated with stature, and hence with temperature. The second principle coordinate, which mainly measures facial and nasal shape, serves to separate the various groups of Indians: (i) Maharashtra upper caste, (ii) Gujarat and Konkan, (iii) West tribal and lower caste, (iv) Central and Eastern tribal, (v) Bihar and Bengal, (vi) Vedda and South Deccan tribal, (vii) Orissa upper caste, (viii) UP upper caste, (ix) Pahari bhotia, (x) South India and Ceylon and (xi) Kashmiri, Punjabi and Pahari. The third component clarifies the separation of (i)-(iv), (v)-(vii) and (ix) out of the rest.
In a limited genetic tree, Indians form a number of distinct clusters: (i) Central Indian and Brahmins, together with South Indians cluster with Westen Asians (cluster formed by Iranians, Uzbeks, Caucasians, Lebanese and Turkish, Jordanian, Assyrian, Armenians), (ii) Sri Lankans and South Dravidians break off earlier, and (iii) North and Central Dravidians along with the East Indians break off before the cluster formed by the previous two groups and the Arabians including Bedouins. The first two principle components do not separate the Indian population: they only separate the caucasoid group discussed so far, from the South East Asians with Gurkhas, and from the North East and East Asians with the Bhutanese.
When only the Indian populations are analyzed, the branching order changes somewhat. Now, the third of the Indian clusters mentioned is an inner group and consists of a cluster of Munda and North Dravidians with Central Dravidians and a separate one of Marathan and Maharashtrian Brahmins with Bhils and then Rajbanshis, with a cluster consisting of Bengali Brhamins and Parsis splitting off its base. A cluster consisting of the second and most of the first of the previous groups is sister to it. (The first group, of course, is now resolved: Punjabi, Central Indian form a group with Punjabi Brahmins and the Rajputs; Vania and Jats form a sister cluster with Bombay Brahmins. Koli and Kerala Brahmins along with Pakistanis form a cluster off the base of all this.) Kanet and UP Brahmins seem to form a cluster branching off earlier, and Gurkha and Tharu a cluster even earlier. The Kerala Kadar seems to come from a completely different branch.
The detailed structure of the clusters probably needs more data to be established. As far as Bengal is concerned, the tribals cluster with North and Central Dravidians; and Bengalis as a whole cluster with these and Maharashtrians. However, the importance of caste shows up; except in Punjab and Maharashtra, the Brahmins do not cluster with the other castes. On the other hand, the Brahmins of different regions do not cluster together either; in a two principle component analysis, brahmins from Bombay, Kerala, UP, Punjab, Maharashtra and West Bengal show a steady progression along the diagonal. This could be due to genetic drift in these highly endogamous units.
An old study in bengal found that the main blood group is O, though B dominates among the kAYastha caste (vaNika show both), and A among the tribals and shaGkhavaNika. A later study agreed that the main blood group was O, but found the same in kAYastha and vaidya; but found B dominate the rest. The muslim population shows all of O, A, and B.
![]()
![]()