Neighbor-joining tree generated
from bi-allelic deletion
copy number variations
from the supplemental material of
Sudmant et al..
As opposed to a large part of the Y chromosome and mtDNA which are
uniparentally inherited and which are discussed on my main
genealogy page, the autosomal DNA is inherited from both
parents and undergoes recombination. As a result, tracing deep
genealogy through it needs a rather different kind of analysis in
which we try to determine it as an admixture of different ancestral
pools of DNA. The resulting analysis will, of course, depend on
which these pools are chosen to be, and that shows up in the
analyses presented here. Overall, I am a rather typical
representative of an East Indian population: closer to Europeans than
to East Asians or Africans; but not as ‘pure’ South
Asian as South Indians: with tinges of Central or West Asian and
North European in the mix.
A common point of confusion concerns the similarity numbers: the
typical similarity between humans from different parts of the world
is 99.5% or more. Most of the differences are, however, small or large
repeats which are usually not sequenced, and even identical twins
are often slightly different if we count these differences. On the
other hand, if we only count base change, the typical similarity
exceeds 99.9%; that, however, still leaves about 3–4 million
differences scatterred all over the genome. These changes are
slow, and hence most of these are inherited over tens of thousands
of years: so we can find the likely places of differences between
people. The tests that form the basis of most of the analysis,
focuses on about a million of these locations where variation is
expected, so that within these, typically unrelated
individuals may have as little as 67% similarity. The similarity
of people within a racial group, especially outside Africa, is,
however, much higher: often rising to above 73% within even large
groups of people.
Harappadna analysis
Me (HRP0054, white square) placed close to the Biharis
and Maharashtrians
in a PCA analysis of the autosomal data from Asian
populations as a 3d image (go here
for a bigger view)
or
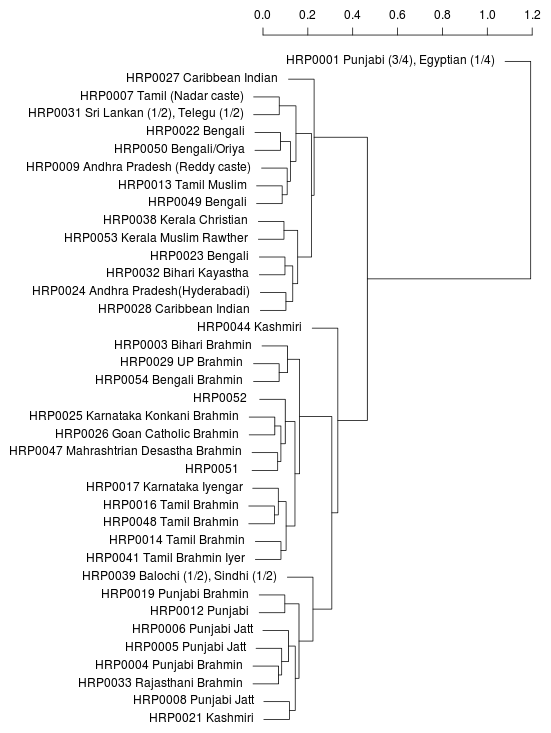
a dendogram (click it for full size). The dendograms makes clear that the
affinity is to the Brahmins.

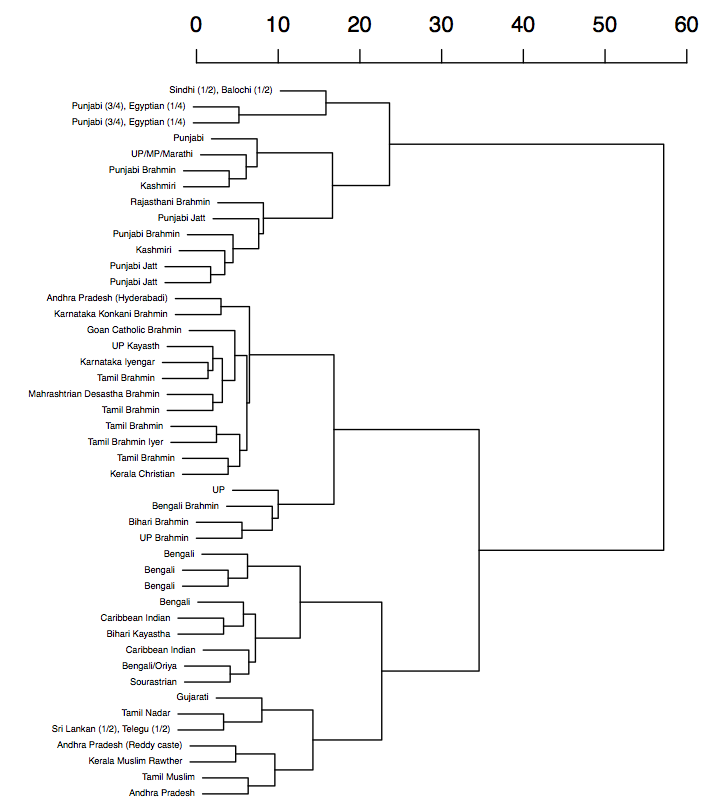
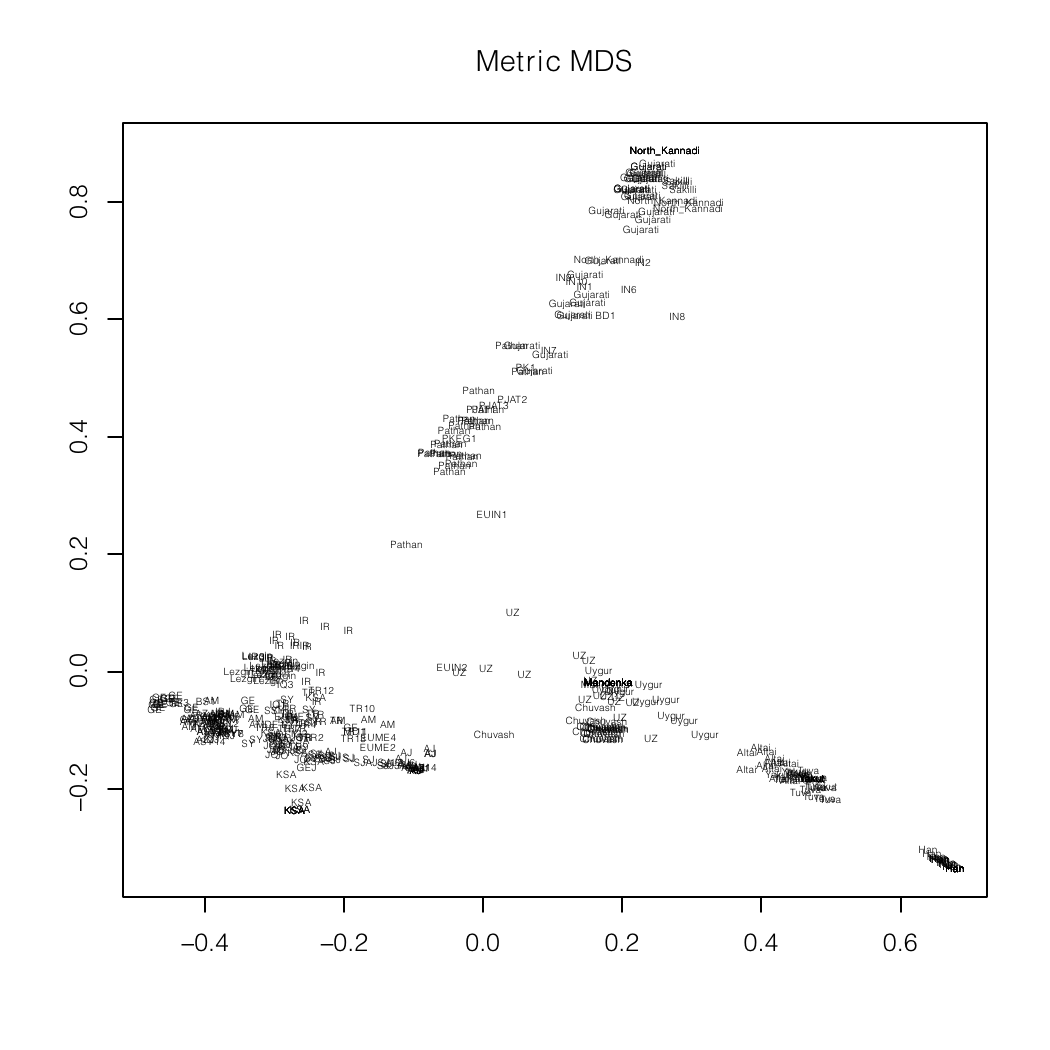
Nonmetric MDS plot and a dendogram of a mixture analysis of
autosomal data (I am ‘Bengali Brahmin’ near (0,-3))
from the Indian subcontinent.
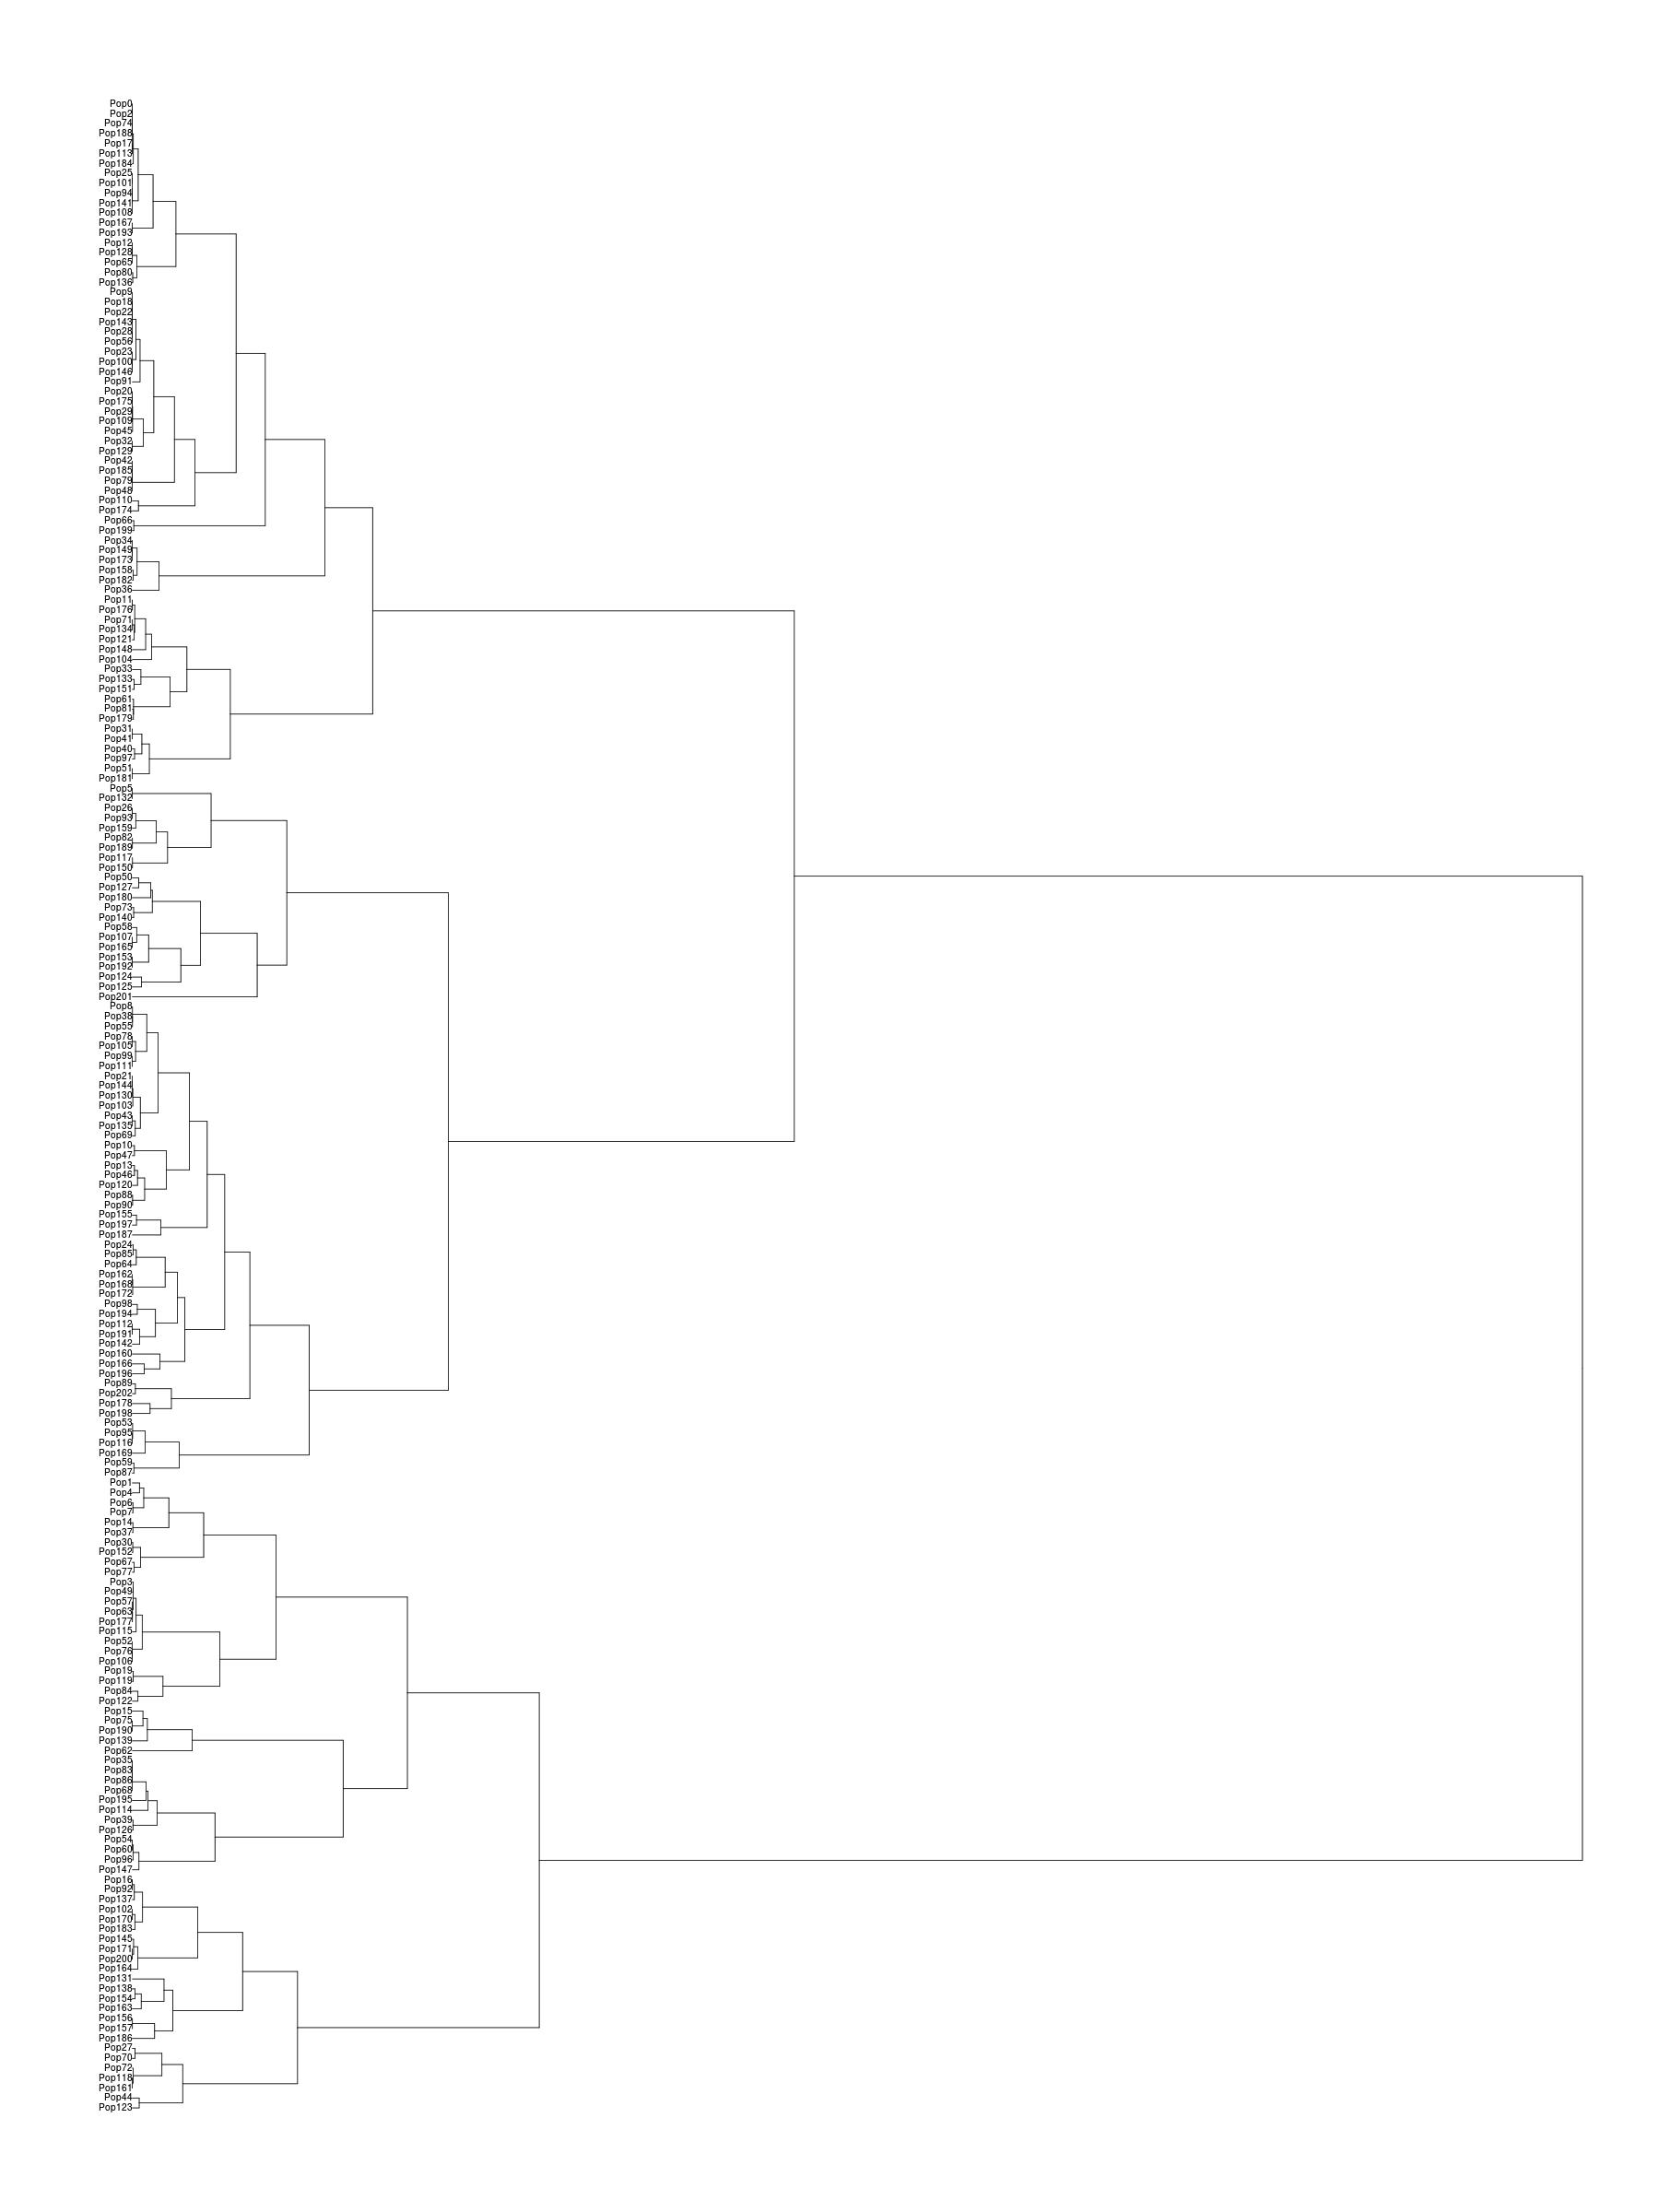
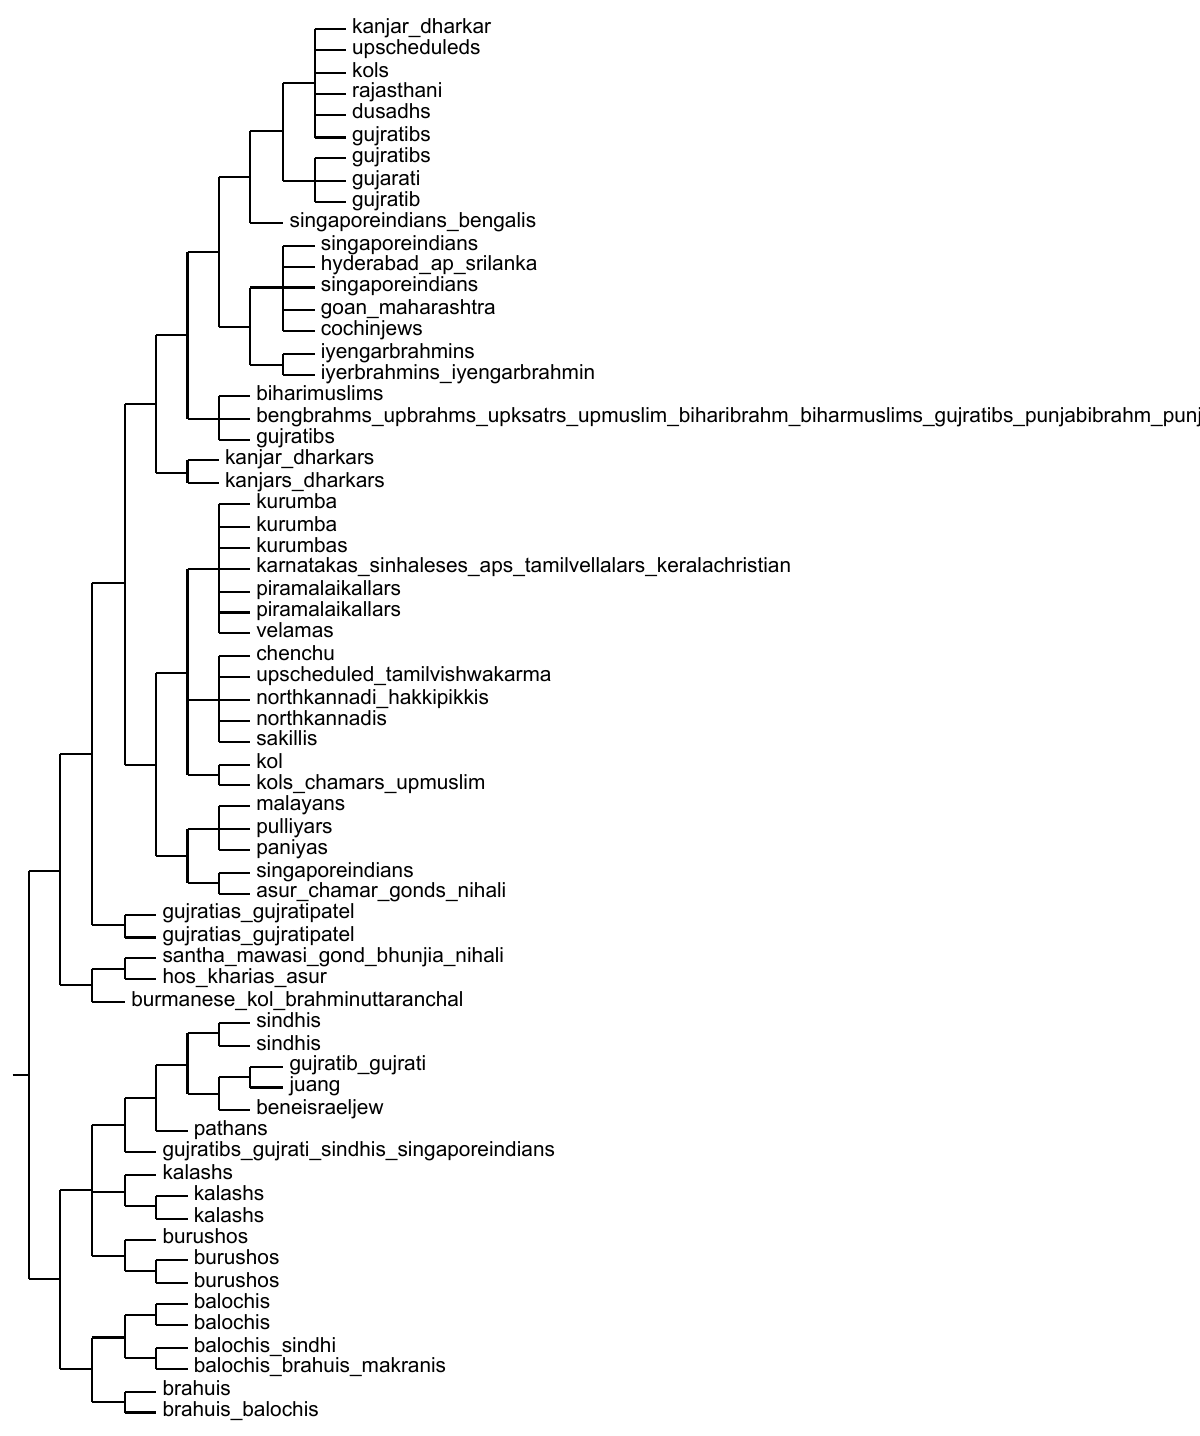
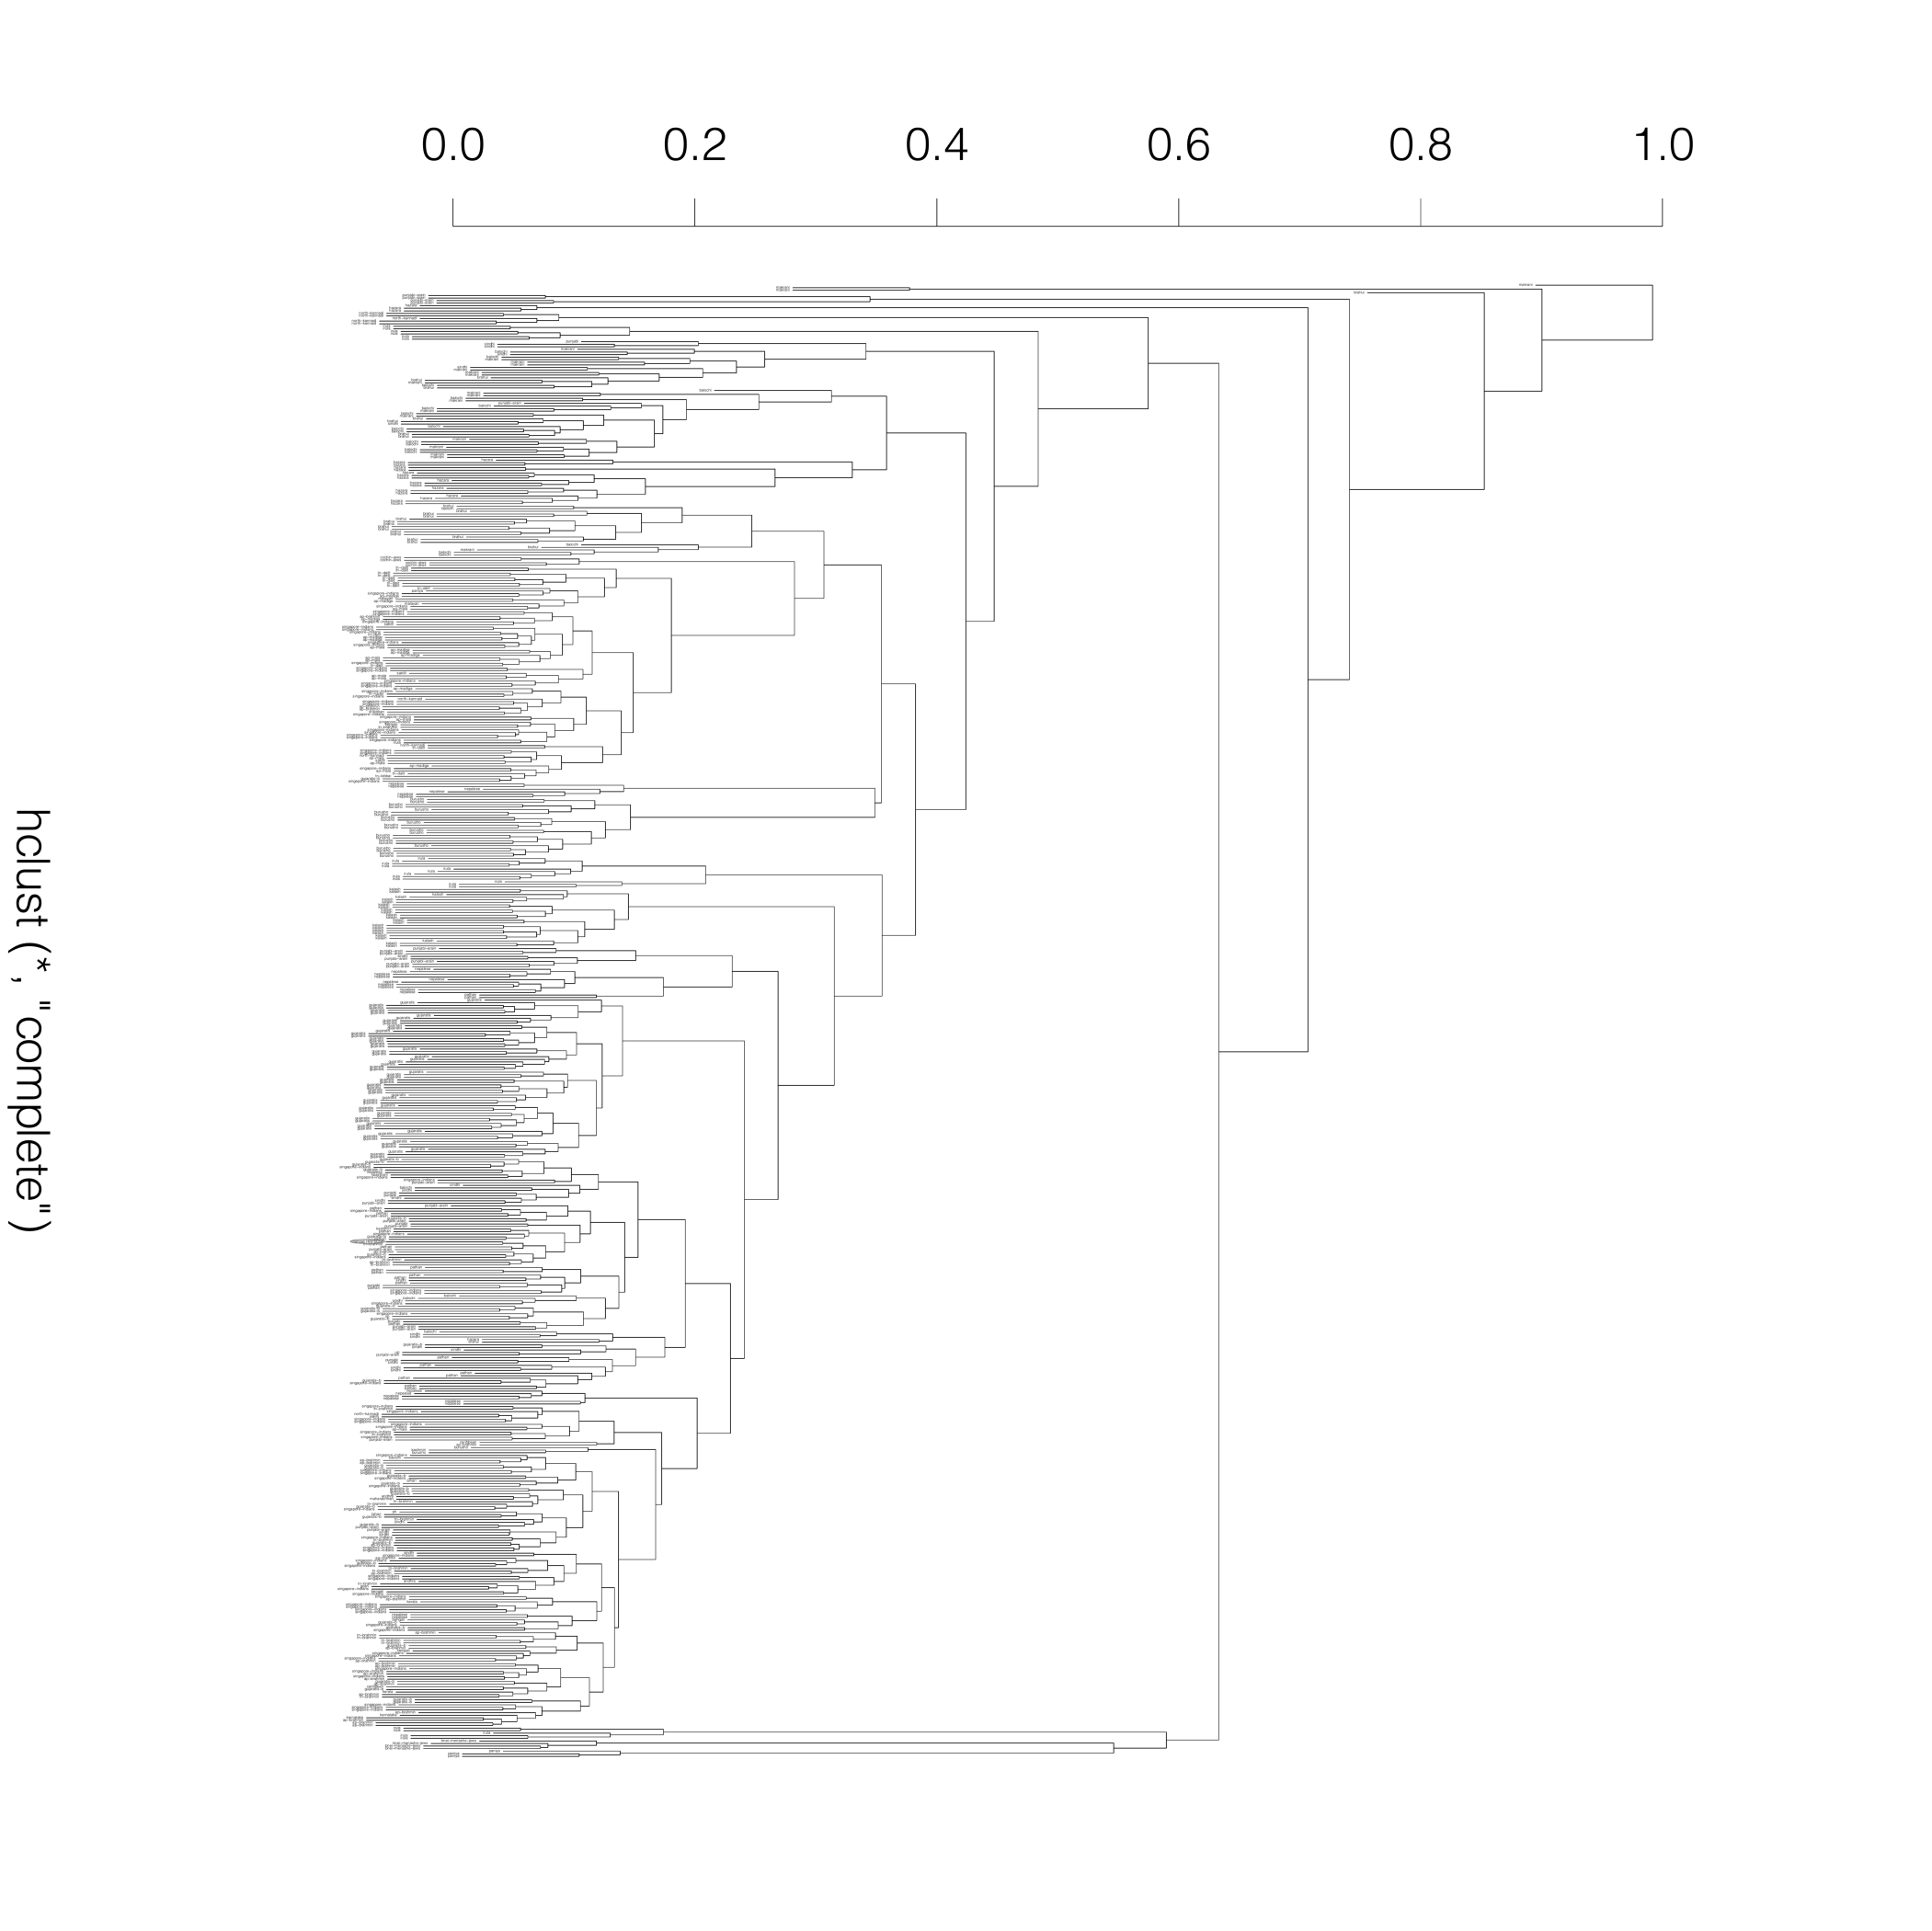
A dendogram showing the populations from Eurasia
according to a finestructure
analysis. I am ‘bengalibrahmin1’
belonging to ‘pop185’. On the right the Indian clade is shown
with the populations given symbolic names.
The Harappa Ancestry Project
by Zach specializes in South Asian samples and performed a 4-way
and 12-way
admixture 1.04 analysis on its participants including me. In the former
analysis, I had 60% S Asian, 33% European, 7% E Asian, and no African
component, whereas in the latter analysis, I had 61% S. Asian,
20% Baloch/Caucasian, 10% European, 4% Kalash,
3% SE Asian, 3% Siberian, and no SW Asian, Papuan, NE Asian, E Bantu,
W African, or E African. (These group names are just labels: see the maps
created by Simranjit, and the ones
he created for the Brahmin participants, for an idea of what they are.) At
the intermediate K=9 level, I am 62% S Asian, 19% Kalash, 11% European,
3% SE Asian, 2% SW Asian, 2% NE Asian, and no Papuan, W. African or E.
African. If only the South Asians, excluding the Kalash and Hazara are
studied: a 3-way admixture with me being 33% S Indian, 30% Balochi and
37% gujrati is most aupported. A PCA
analysis shows
that the brahmins from different regions cluster togther, though the Punjabis
fall into the Punjabi Brahmin cluster. I (HRP0054) am most closely related
to UP and Bihari Brahmins, which forms a cluster with Maharashtrian and
South Indian brahmins. Using Mclust on this PCA data shows 14 significant
clusters: I belong to 81% Cluster 3 and 19% Cluster 6; which among the
reference populations (balochi, bnei-menashe-jews, brahui, cochin-jews,
gujratis, makrani, malayan, north-kannadi, paniya, pathan, sakilli, sindhi,
and singapore-indians) has one of the two Gujrati cluster and some Singapore
Indians. The 3d plot of the first three PCA components show these are not
very close, however. The analysis of what he calls the Ref 2 set provides a
more global view, but does not change these conclusions. The Ref 3, however,
is more interesting: in this analysis, I am 54% S Asian, 23.6% Onge, 14%
European, 4% South West Asian, 2% each of E Asian and Siberian, and no W
African, E African, San/Pygmy, Papuan or American. The interesting thing
here is the separation of S Asian and Onge components (see
here
for the maps): the Onge component correlates linearly with the Ancestral South
Asian component (see next section). In particular, ASI component is 1.3261
times the K=11 Onge component in this analysis plus 7.4125 with an
r2 of 0.994. This can be used to calculate my ASI component asi
37.43%, slightly higher than that calculated in the next section.
The admixture analysis still puts me in close proximity with the
Bihari and UP brahmins, but somewhat further from, though still in a
clade with, the S Indian brahmins. In this analysis, the Punjabis
are outside the South/West/East Indian clade. In the Identity by State
analysis and one using population concordance measure again show clear South
Indian and Brahmin similarities.
A finestructure
analysis of the Eurasian populations clusters me
into a group ‘pop185’, which is mainly North Indian Brahmins and
Kshatriyas with some Gujratis and north Indian muslims. This group is
a part of a tight cluster with Bihari muslims and more Gujratis. This entire
group is part of the mainly north Indian cluster, which, however, also
includes the Iyer/Iyengar brahmins, Cochin jews, Goans and Maharashtrians,
and a few people from Andhra Pradesh and Srilanka. This north Indian group
is sister to a clear South Indian cluster, with the Austrasiatic tribals
forming an outgroup. The Sindhis, Kalash, Burushos, Balochis, Brahuis,
Makranis, Pathans and Bene Israel Jews form a separate Indian cluster. The
entire Indian group, however, is a sister to the other Asians.
Dodecad Project analysis
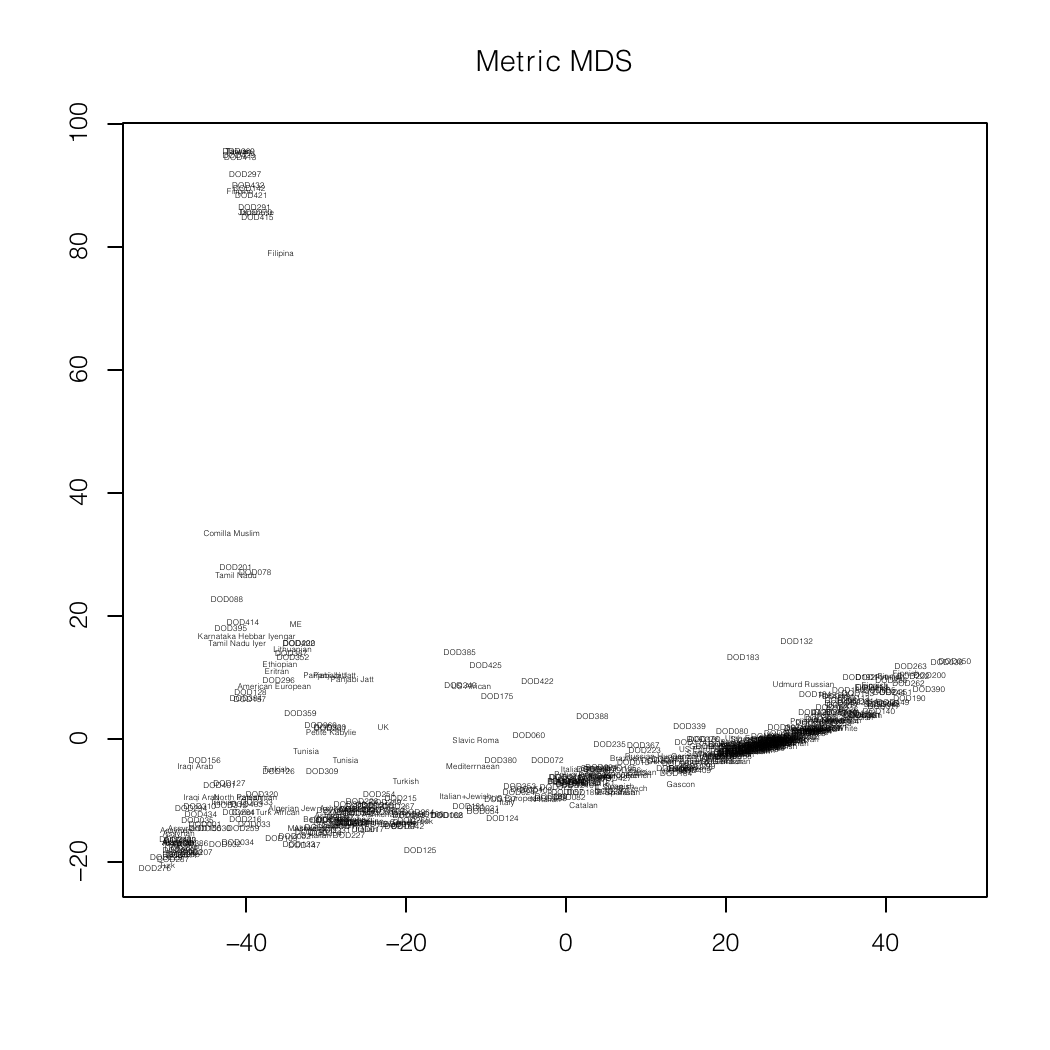
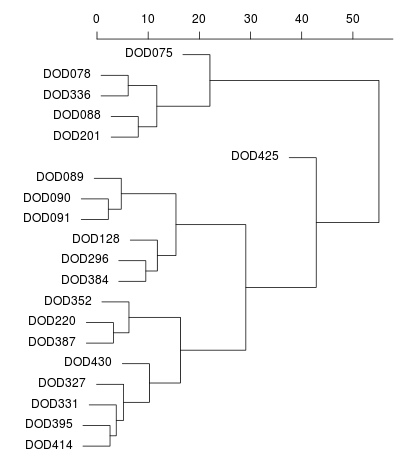
Me (near -40,20) on an MDS plot and as a dendogram created
by Zack.
In the latter, I am
DOD430. DOD327 is Tamil Nadu Iyer and DOD331 is Karnataka Hebbar Iyengar.
The North-West Indians (Punjabi, Sindhi, Balochi, etc.) are in the cluster
with Zack (DOD128).

 A
mixture analysis of
my autosomal data.
A
mixture analysis of
my autosomal data.
The Ancestral North Indian and Ancestral South
Indian populations
whose mixtures create most of the Indian
populations according to a
recent study.
A more recent studyi
finds that a four component Admixture fits the Indian data (outside Andaman, which
is distinct) better, and West Bengal brahmins are about 76.63% ANI, 9.94% ASI, 10.1%
ancestral Austro-Asiatic and 3.32% ancestral Tibeto Burman. The study
also finds that exogamy probably stopped 68.3778, 69.5409 and 63.3518
generations back from the ASI, AAA and ATB populations respectively.
The Dodecad project also
performs a multiway mixture analysis and
parses me as 62.5% South Asian, 23.2% West Asian, 9.5% North European, 3.3%
East Asian, 1.4 Northeast Asian, and none of South European, Southwest Asian,
or Northwest, West, and East African. This project does not
maintain a list of ethnicities, but project participants are free
to reveal it. Using this, I performed a 2-d MDS analysis and this
shows that I am a somewhat extreme member of their Indian cluster
which otherwise has only South Indian, Punjabi Pathan and Comilla
Muslims as identified members. The Indian cluster, not
surprisingly sits apart from both the European/West Asian and the
Filipino clusters. In an 11 dimensional cluster analysis, I belong
as an outlier to cluster 17, which contains 8 project members (all I
could trace were South Indians) and 6/25 of the Gujrati reference
populations, but none of the 9 North Kannadi, 24 Sindhis, 22 Pathans, or
25 Burushos.
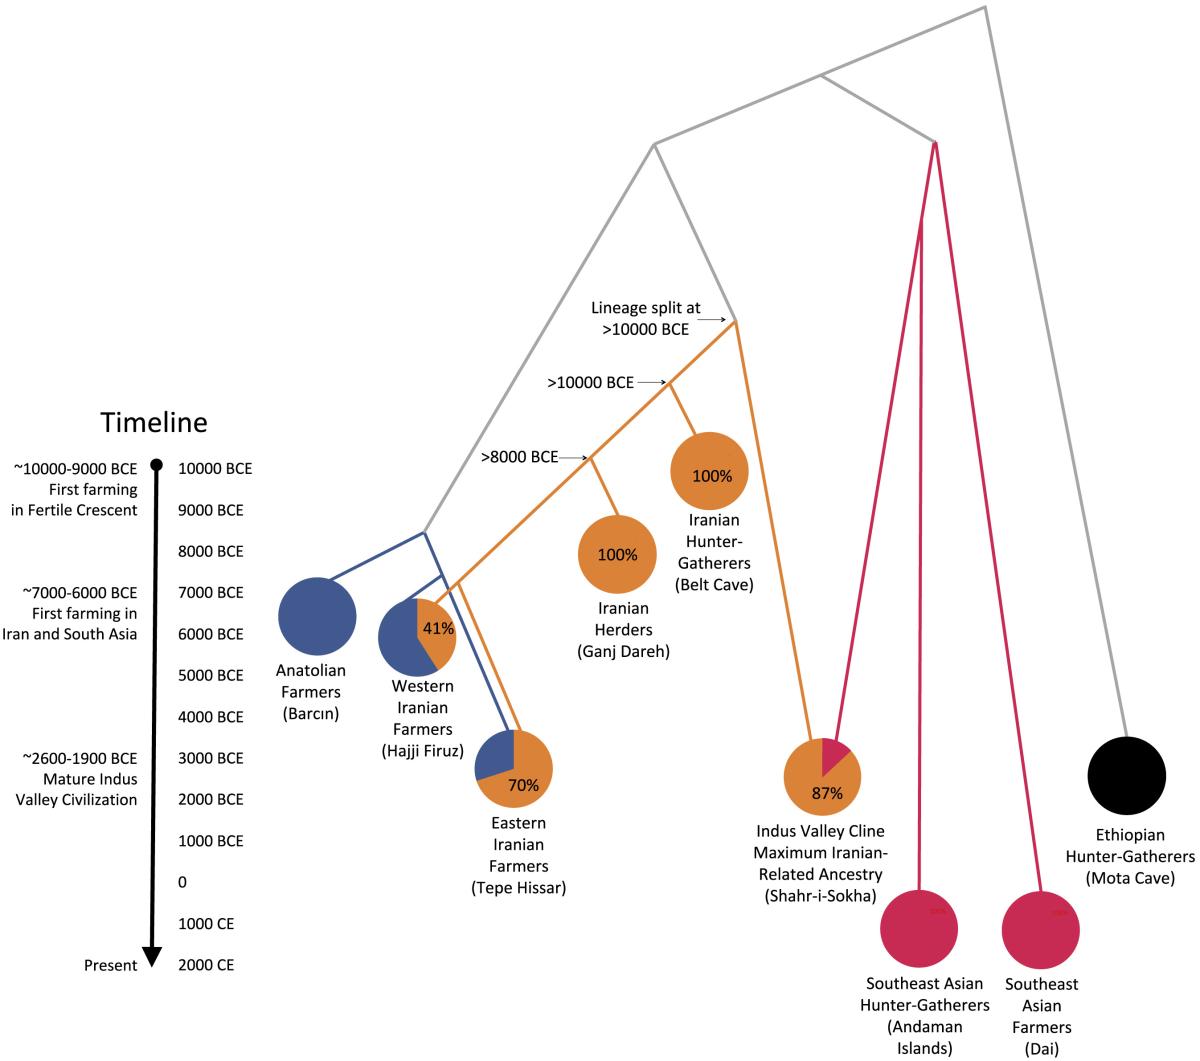
The origin of the Indus population as a mixture of an
old
Iranian population and an Ancient Ancestral South
Indian one. See the
research article
for details.
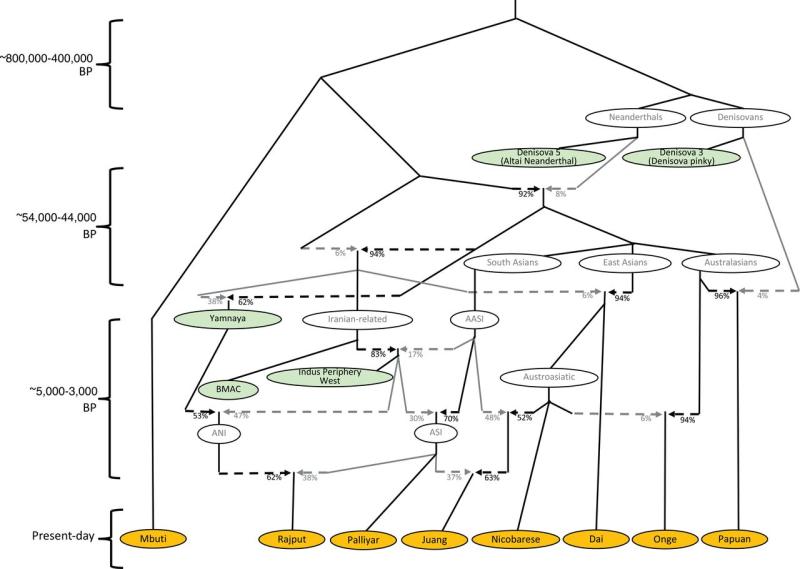
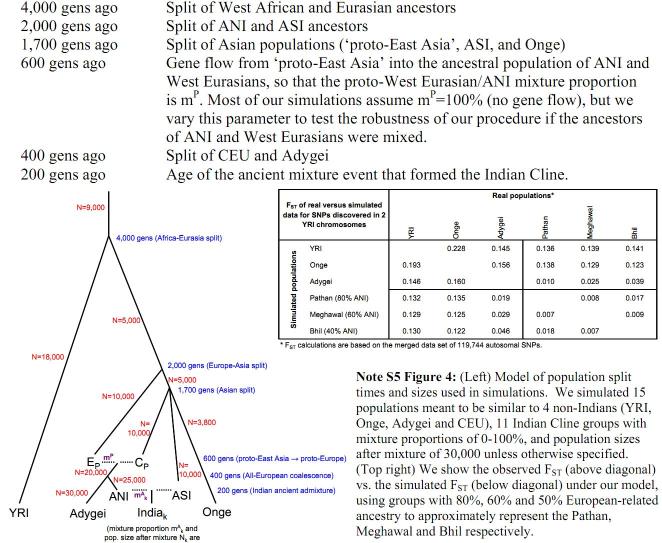
The origin of the Ancestral North Indian (ANI) and
Ancestral South
Indian (ASI) populations as a mixture
of the Indus population with Ancient Ancestral South
Indians
(AASI) and descendants of the Yamnaya
people. See the research article for
more details.
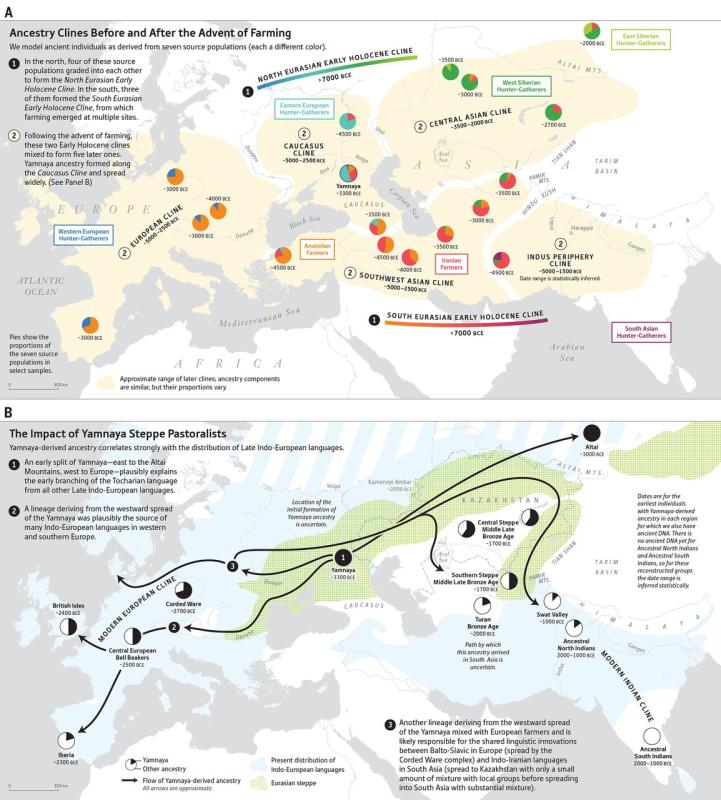
Population movements reshaping the ancient population clines in
Eurasia
according to a research article
studying ancient DNA
On an admixture analysis of the Indian participants using K=4, I (DOD430)
turn out to be 30.6% West Eurasian, 4% East Eurasian, 65.4% South Asian, and
0% African. Interestingly, this K=4 analysis maps
on to the ancestral
north Indian and ancestral south Indian populations identfied in a
study of Indian
populations in a particularly simple way: the ANI fraction is given
as 0.779 times the West Eurasian fraction + 0.39674; with a
r2 of 0.9823. As a result, I can be inferred to be about
63.5% ANI (Caucasoid), 32.5% ASI and about 4% East Eurasian (Mongoloid).
More detailed studies of ancient DNA provides a pretty finely resolved ancestry to the
ANI and ASI components. Briefly, the results is that old Iranian and Ancient Ancestral
South Indian (AASI) populations mixed in about 83:17 ratio around 4500 years back
forming a population residing around the Indus valley. These then mixed further with
the AASI in approximately 30:70 ratio to give rise to the ASI population about
4000 years back, whereas around the same time these Indus residents mixed with
descendants of the Yamnaya culture (about 5000 years back) in about a 47:53 ratio
to give rise to the ANI.
Eurogenes analysis
Me (BD1) placed squarely among the North Indians
(Gujrati)
in an autosomal MDS plot of Asian populations.
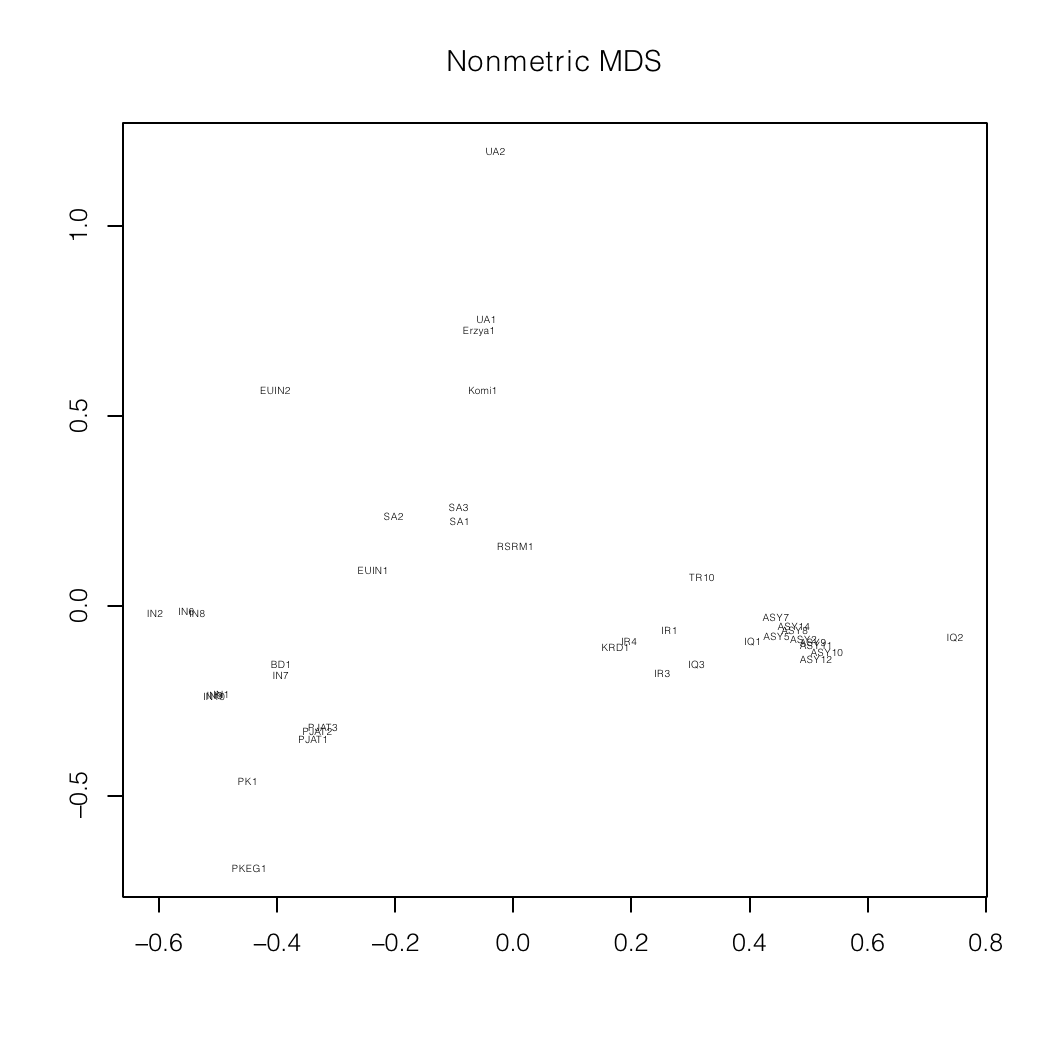
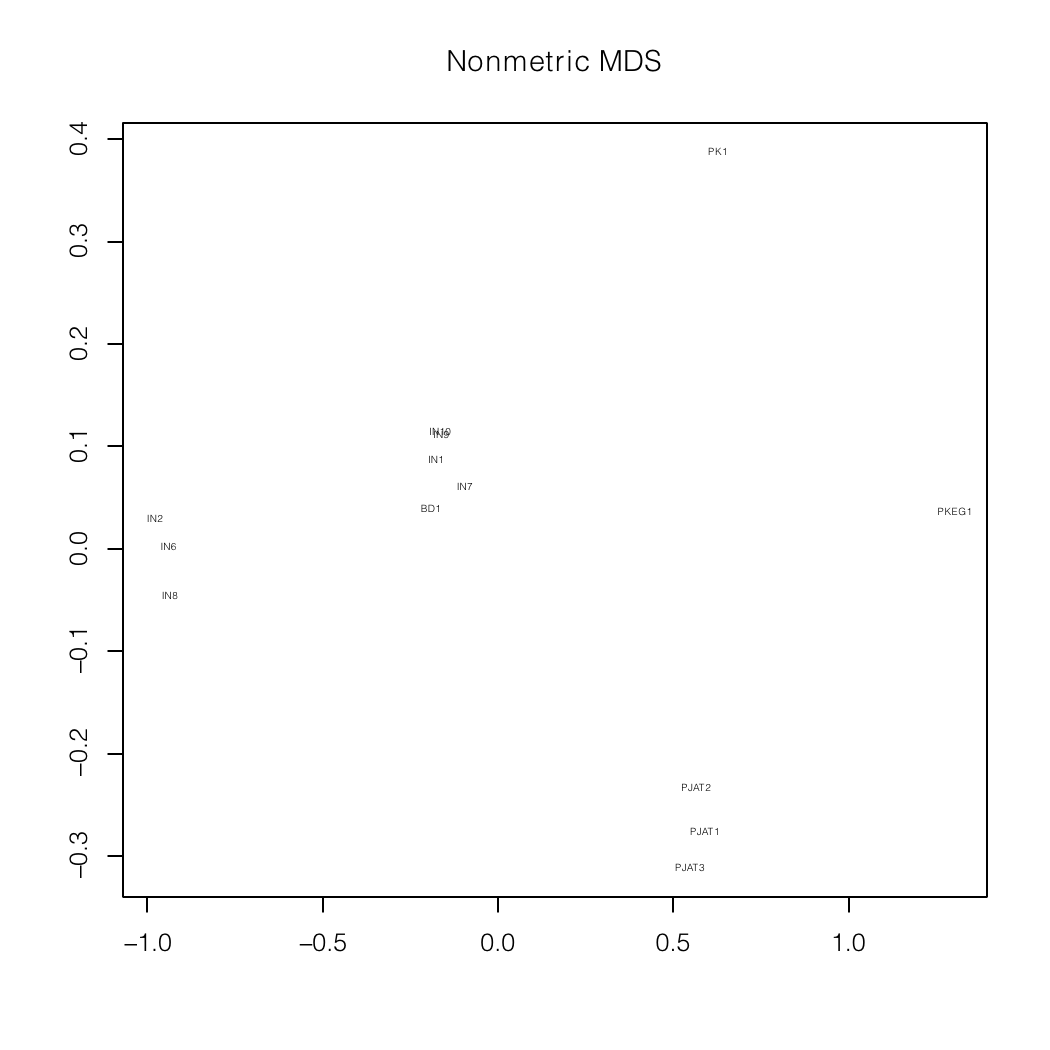
Nonmetric MDS plots of a mixture analysis of
my autosomal data (BD1)
specialized for South Asia and the Indian
subcontinent.
The Eurogenes project
recently performed an analysis of their West+South+Central Asian
samples using a seven
way Structure
analysis. In this description, I am 72% South Asian, 13% European, 10%
Caucasus, 3% East Asian, 2% Siberian, and no Middle Eastern or Sub-Saharan
components. I did a 2d mds analysis of this, and I am clearly in
the North Indian cluster. In a separate supervised analysis of the
South and West Asian samples in which the base populations were held fixed,
my autosomal genetics could be explained as a mixture of about 44% South/West
Indian (represented by North Kannadi, Sakilli and selected Gujrati)
40% Pakistani/NorthWest Indian (represented by Pathan and Sindhi), 9%
Burusho, 3.5% North
Slavic (represented by Polish and Belorussian), 2.5% Han Chinese, 0.08%
Siberian (represented by Koryak, Nganassan and Yakut), 0.002% each of Balochi
(including Brahui and Makrani) and West/Southern European (represented by
French), and 0.001% of each of Anatolian-Caucasus (represented
by Armenian and Georgian), Sub-saharan African (represented by Mandenka and
Yoruba) and Middle Eastern (represented by Jordanian and Palestinian). A
nonmetric 2d MDS analysis clearly shows a region containing the samples
from the Indian subcontinent; and a
non-metric MDS analysis within the Indian cluster splits it into
a mainly South Indian, an equimix Nort/South Indian (including me), a
PJAT cluster with sizeable Balochi contribution, a Pakistani individual
with sizeable Burusho, and another (PKEG) with sizeable middle eastern,
contributions. In each of these latter cases, the North Indian component
stays high, it is the South Indian component that predominantly gets
replaced. In a K=8 analysis of populations from the ‘Neolithic
belt’ I turn out to be 77.4% S Asian, 15.5% European+Anatolian, and 7%
E Eurasian, with no N, WC, W, or E African, and no middle eastern.
23andme analysis
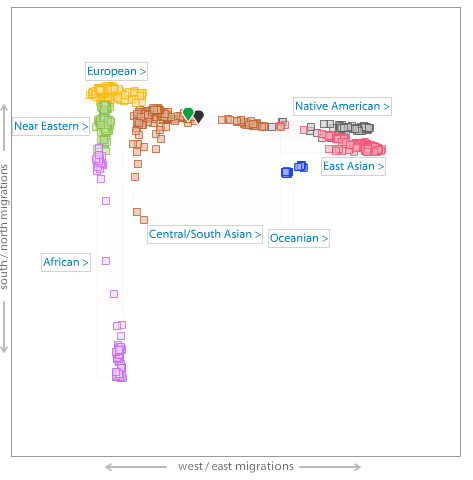
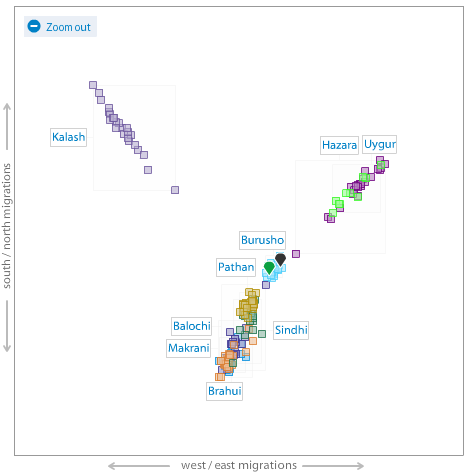
Me (green pointer) on an autosamal MDS plot of World and South Asian populations.
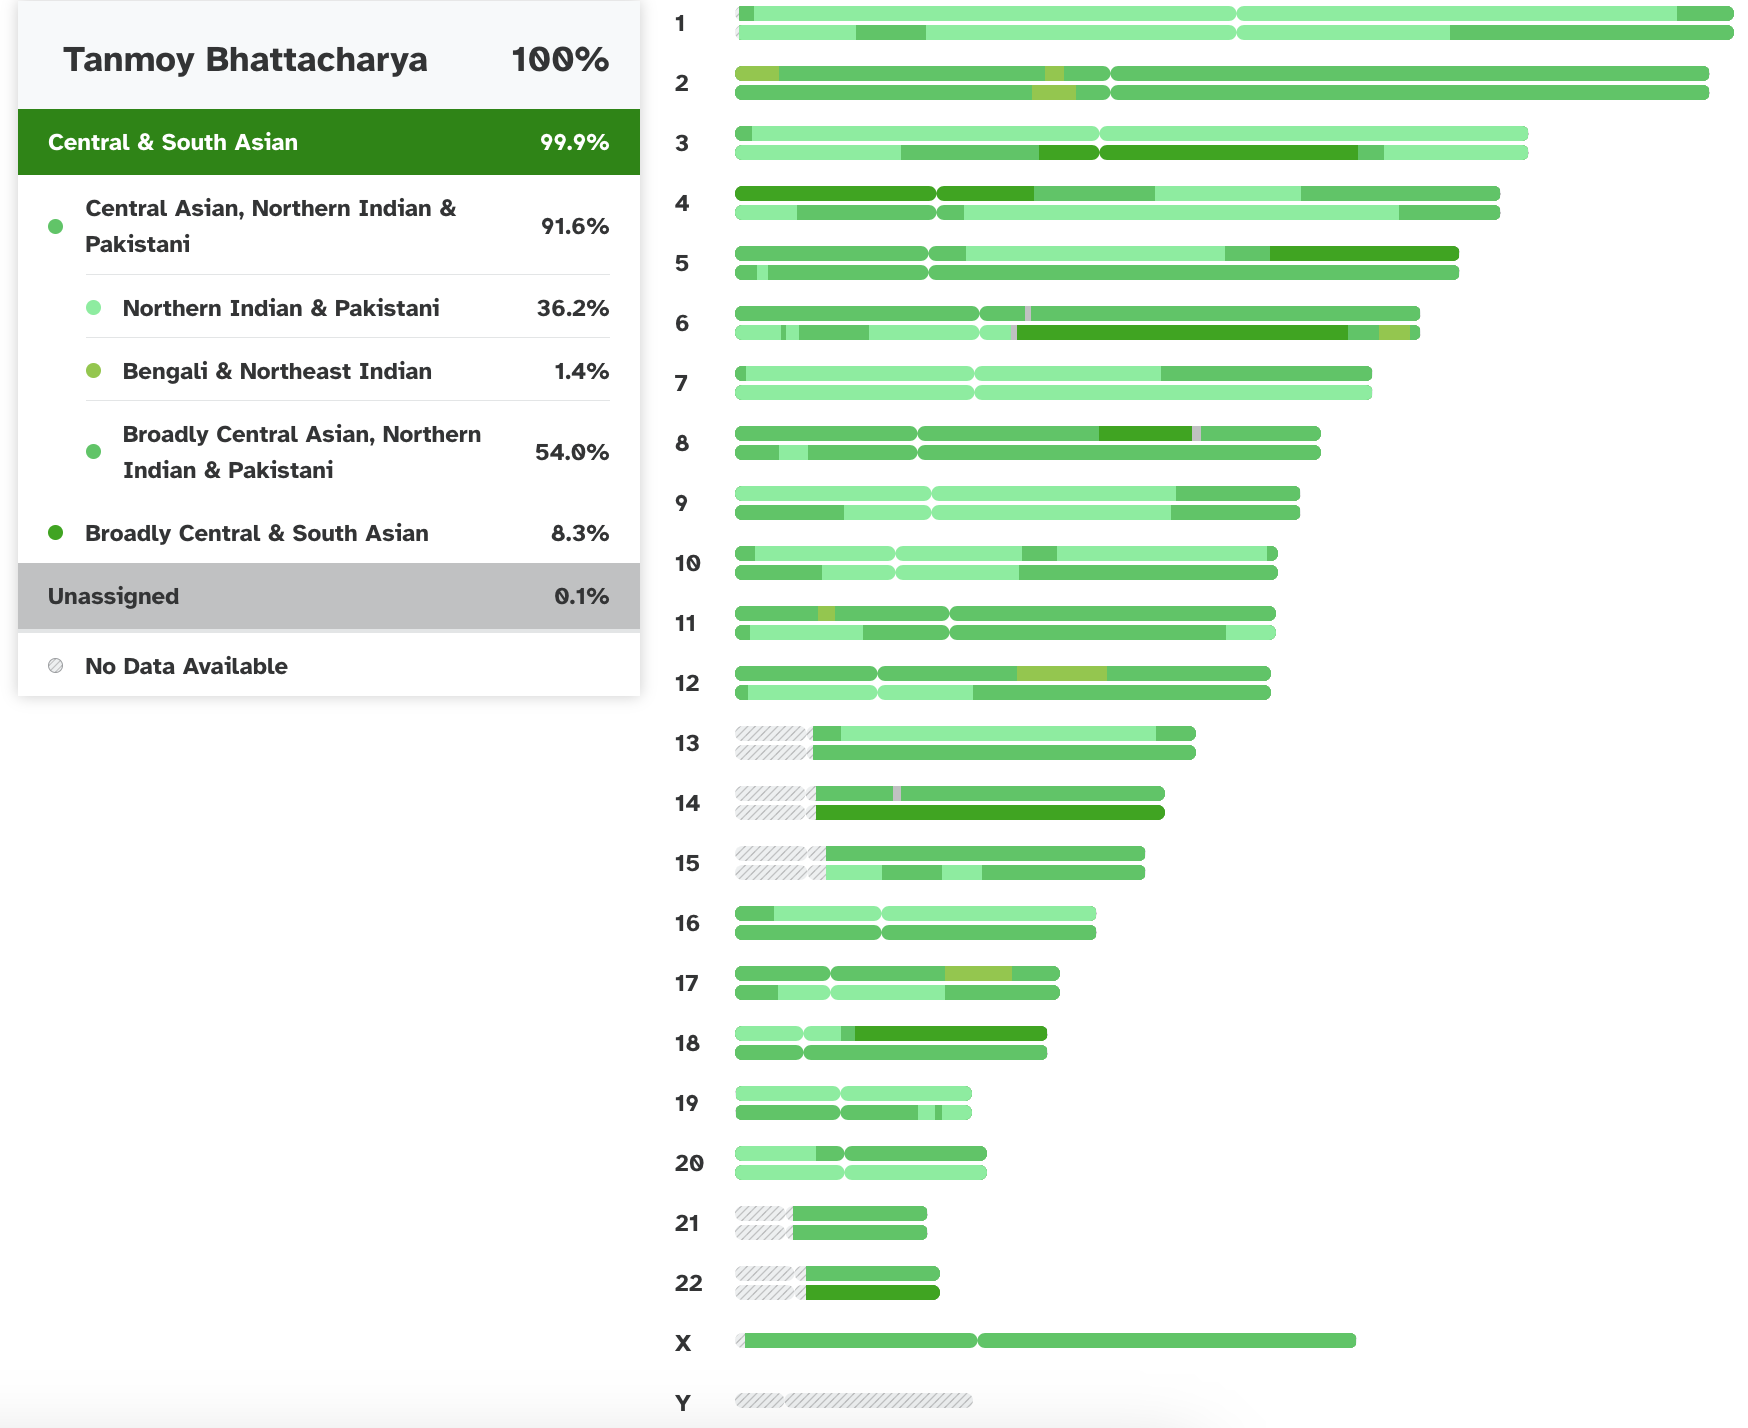
Various ancestral contribition to the individual chromosomes according
to 23andme analysis. Grey indicates lack of information.
Currently, 23andme classifies me as 99.9% Central and South Asian (48.6% paternal and 51.3% maternal):
97.8% Central Asian, Northern Indian or Pakistani
(which breaks down as 77.0% Northern Indian or Pakistani, 19.2% Bengali or Northeast
Indian—Dhaka Division, Bangladesh, and 1.6% broadly Central Asian, Northeast
Indian or Pakistani), 1.5% Southern Indian, 0.6% Southern South Asian (which is
Southern Indian or Sri Lankan), and 0.1% unassigned (all maternal).
It thinks that 1–2 generations ago I had a pure North Indian or Pakistani
ancestor, 2–4 generations back, a pure Bengali or North Indian ancestor,
and more than 5 generations back both a Southern Indian and a Southern Indian or Sri
Lankan ancestor.
Earlier, 23andme would classify me as 86.1% South Asian, <0.1% East Asian &
Native American, none of European, Middle Eastern & North African,
Sub-Saharan African, or Oceanian, and 13.8% unassigned in a conservaive
analysis (i.e., 90% confidence). In the standard analysis (75% confidence),
the South Asian fraction goes up to
97.4%, the East Asian & Native American goes up to 0.2%, and the
European to 0.1%, still leaving 2.3% unassigned. Finally, speculatively
(i.e., at 51% confidence),
99.4% is South Asian, 0.4% is East Asian & Native American—of
of which 0.1% is Mongolian and another 0.2% is broadly East Asian,
the 0.1% European is broadly Northwestern European, and only 0.1% is
unassigned.
Earlier, 23andme chooses three ancestral populations, which then turn out to
describe the African, European and East Asian populations raher
purely. In this analysis, I am 82% European, 18% Asian and <1%
African (all the African comes from a small region in Chromosome 6
which seems half African). Under an updated analysis with the top
level categories being South Asian, European, East Asian & Native
American, Middle Eastern & North African, Sub-Saharan African and
Oceaninans, this became 96.1% South Asian, 0.1% European, and 0.1%
East Asian (not Native American) in a conservative analysis. The
standard analysis would call a further 2.1% to be South Asian, 0.3%
as European and 0.1% as East Asian. A very aggressive assignment would call
a further 0.9% as South Asian, 0.2% as European, and 0.1% as East
Asian, leaving only 0.1% still unassigned (now adding up to 100.1%
due to rounding). This aggressive mode tries to assign 0.1% of the 0.6%
European as 0.1% Ashkenazi, a bit less than that as Northern European, but
not specifically British/Irish, Scandinavian, Finnish, nor French/German,
and finds no Southern or Eastern Europeans.
Alternatively, we can plot a sample of Indians on a two dimensional
European-Asian plot (since the three numbers add up to one, this is sufficient;
since most Indians have no African content, most lie along a diagonal).
One can, instead try to visualize the distance from their reference
groups in a low dimensional plot. In a 2-d MDS, it then clearly
emerges that I am Central or South Asian. When only these
populations are analyzed, it places me in the regular
progression of
Makrani,
Brahui,
Balochi,
Sindhi,
Pathan,
Burusho,
Hazara and
Uyghur (the
Kalash are separated
along the orthogonal direction: roughly above the Burusho); right in the
center of the Burusho cluster, in fact. Of course, since they do
not have any Indian populations, this is not very unexpected.
Doug McDonald's BGA Analysis
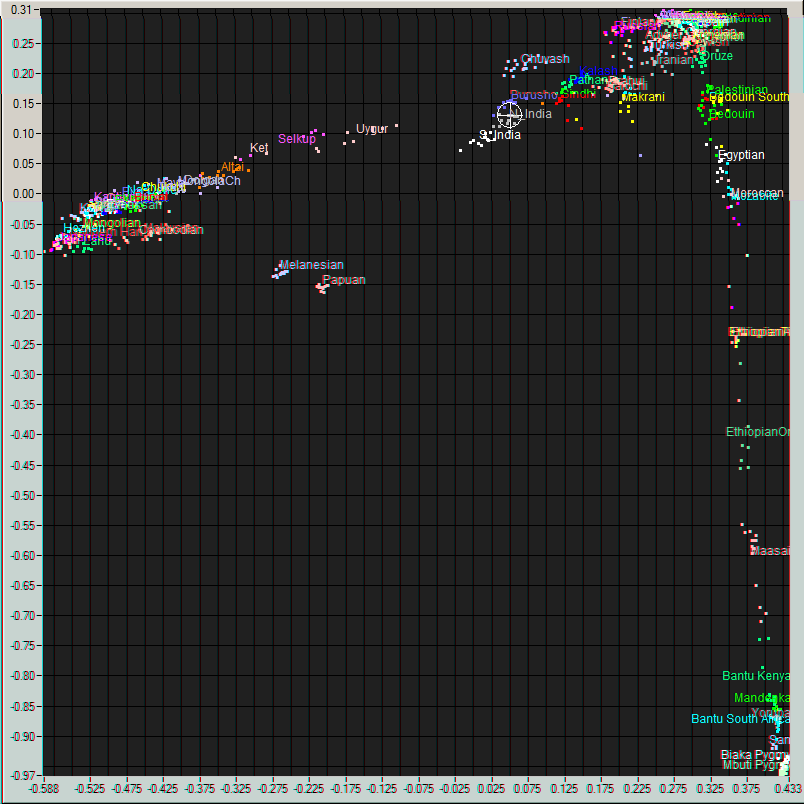
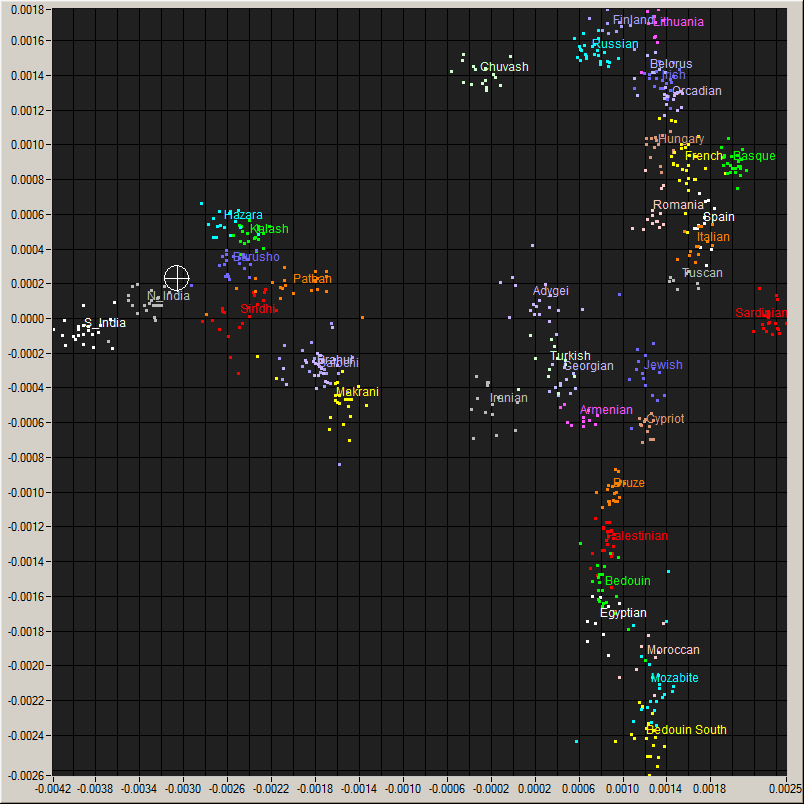
Me (Cross hair) on a plot of World populations and
an enlarged view of the region around me.
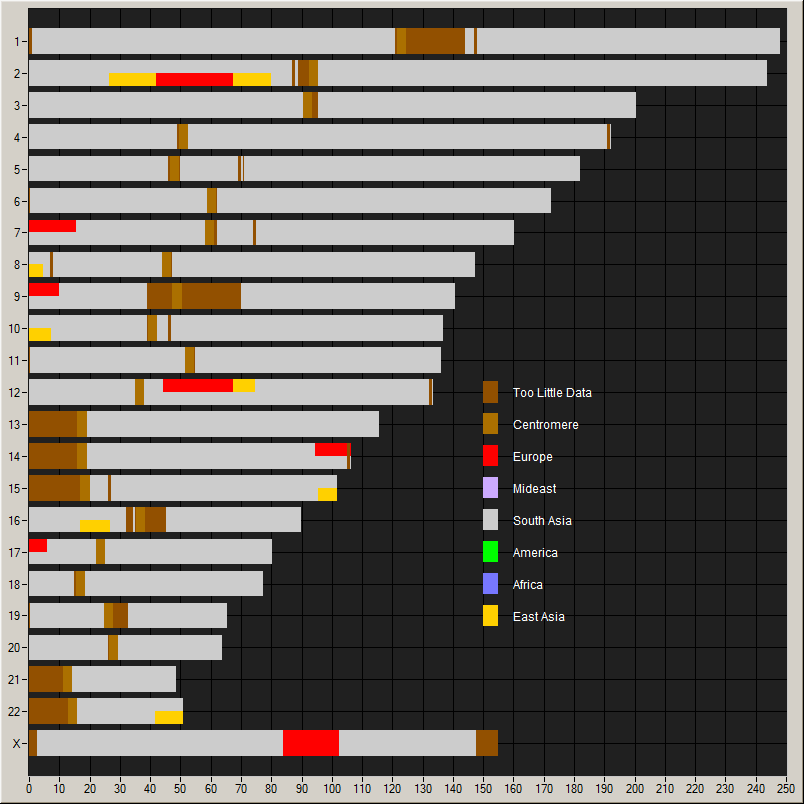
Chromosome painting showing contributions of
various populations.
Doug McDonald has
a BGA
project that can do a similar analysis with a much greater
number of populations. According to him, I best test as 93% North
Indian and the rest Eastern European; but recalling the 23andme
results, 66% North Indian and the rest Burusho fits almost equally
well. This, according to him, is typical of all-South Asian. His
analysis would, therefore, put me at 29.7°N 74.5°E near
Hanumangarh, India on the Pakistani border.
He also provides a chromosome painting: this, he says is remarkably
pure South Asian; only people from South India get purer than this;
thus I am typical.
DNA Land Ancestry Analysis
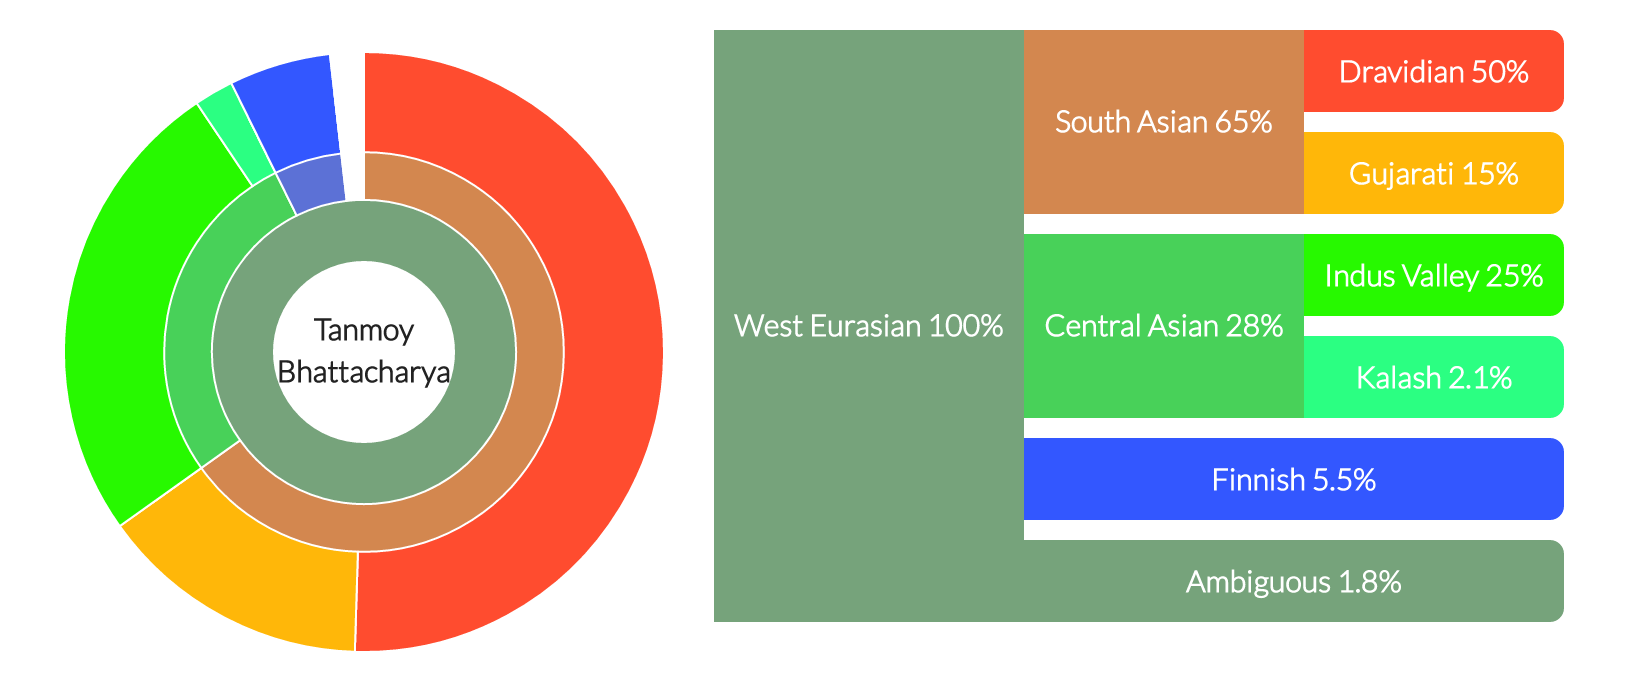
My ancestry composition.
My ancestry composition on a map.
DNA Land does an ancestry analysis according
to which I am 100% West Eurasian which breaks down as 65% South Asian,
28% Central Asian, 5.5% Finnish, and 1.8% ambiguous. The South Asian is
further broken down as 50% Dravidian and 15% Gujrati, whereas the Central
Asian is 25% Indus Valley and 2.1% Kalash.
MyHeritage analysis
According to My Heritage my ancestry
composition is 91.9% South Asian, 5.8% Finnish, and 2.3% Baltic. With middle
level of confidence, it puts me in recent (1900–1950) New York/New Jersey
and at low confidence on the same time frame in China/Taiwan/Hong Kong/Vietnam/Singapore/Indonesia/Malaysia.
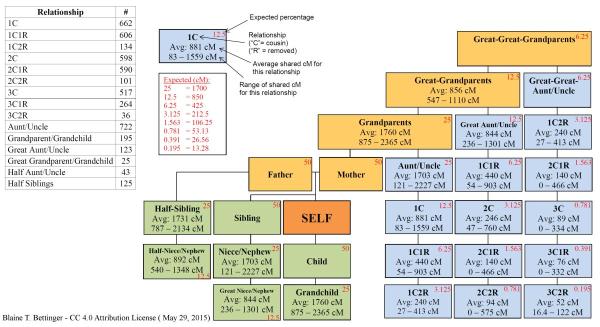
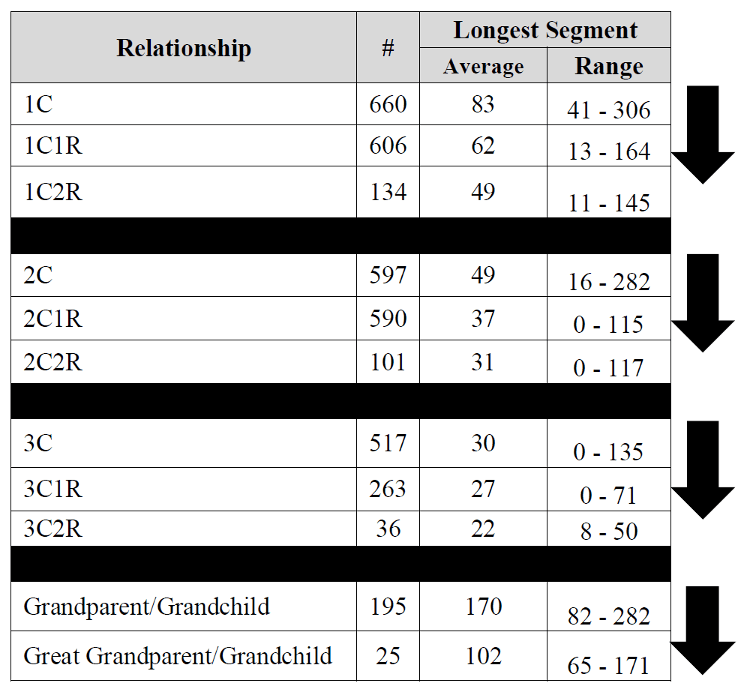
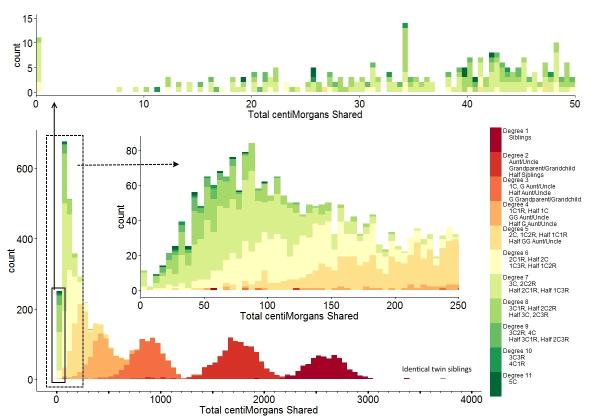
Observed sharing in cM and longest segment from various
degrees of relationship
from the Shared cM project.
The autosomal DNA also lets me search for relatives. As already
discussed in the beginning, overall similarity is difficult to use
because all humans are so similar. Instead, since in each
generation the probability of recombination breaking up a stretch of
DNA is given by its length in Morgans, my first cousin once removed
is expected to have about 20cM long segments
‘half-identical’ to me (half-identical because of
biparental inheritence). Also, in each generation, only
half of the DNA gets transferred from any parent to an offspring,
but since there are two last common ancestors to this cousin (my
paternal grandfather and grandmother, in this case), the toral
amount of match (in these stretches) is
expected
to be about 6% of
the DNA with my first cousin once removed. When I
compare me to Roshni Ray, I
indeed find 25 half-identical regions, ranging in length up
to 62.1 cM with an average of 21.08cM and covering about 7.08% of the
DNA (527cM), and her brother, Krishanu,
has 5.77% (429cM) of his DNA in 20 HIR stretches (max 59.6cM, average 21.45cM).
Another first cousin once removed, Anirban
Chakraborty has 5.46% (406cM) of half-identical DNA in 16 stretches averaging
25.375cM each (largest 23.6cM). Roshni's daughter Aria (my first cousin twice removed, so
should have about 3% of her DNA in 10cM HIR stretches) has
about 2.22% (165cM) of her DNA in 13 HIRs (max 23.6 cM, average 12.69cM). On the
other hand, if I look at just the overall identifty, the similarity even
with Roshni is only about 75.8%, which is pretty comparable to that expected
between unrelated individuals. It is only when I compared to her mother,
my first cousin, Sumita (with whom I could expect an
average of 40cM matches over 12% of the DNA; and indeed find 30 segments
up to 111.1cM, with a mean of 31.5cM over 12.7%, 945cM, of the genome) that
I find an overall similarity of 78.48%, significantly above the
background.
Matches much smaller than 5cM become likely due to other effects
like selective sweeps, and
if the match is on fewer than about 500–800 positions, it
could also be due to random chance at more variable regions. Conversely,
because of the threshold set for the comparisons, an occasional mistyping
can break up a half-identical stretch to make it smaller than the threshold.
Thus my first cousin once removed mentioned above shares with me a 8cM
stretch which is absent when I compare her mother with me.
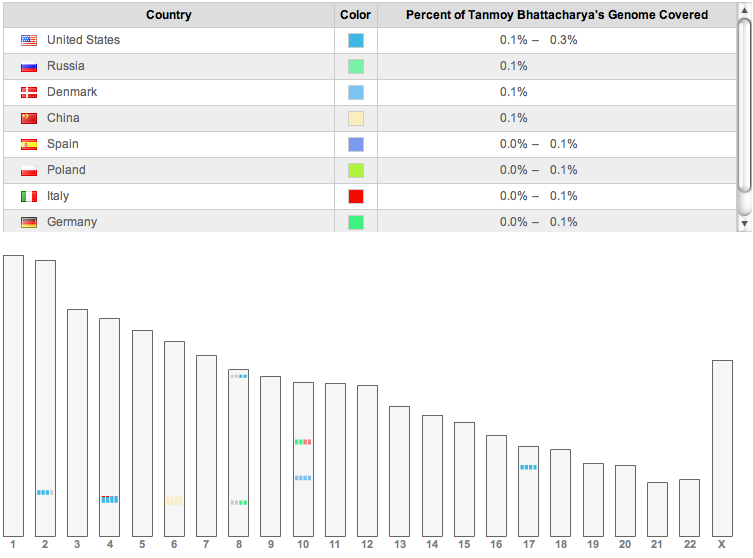
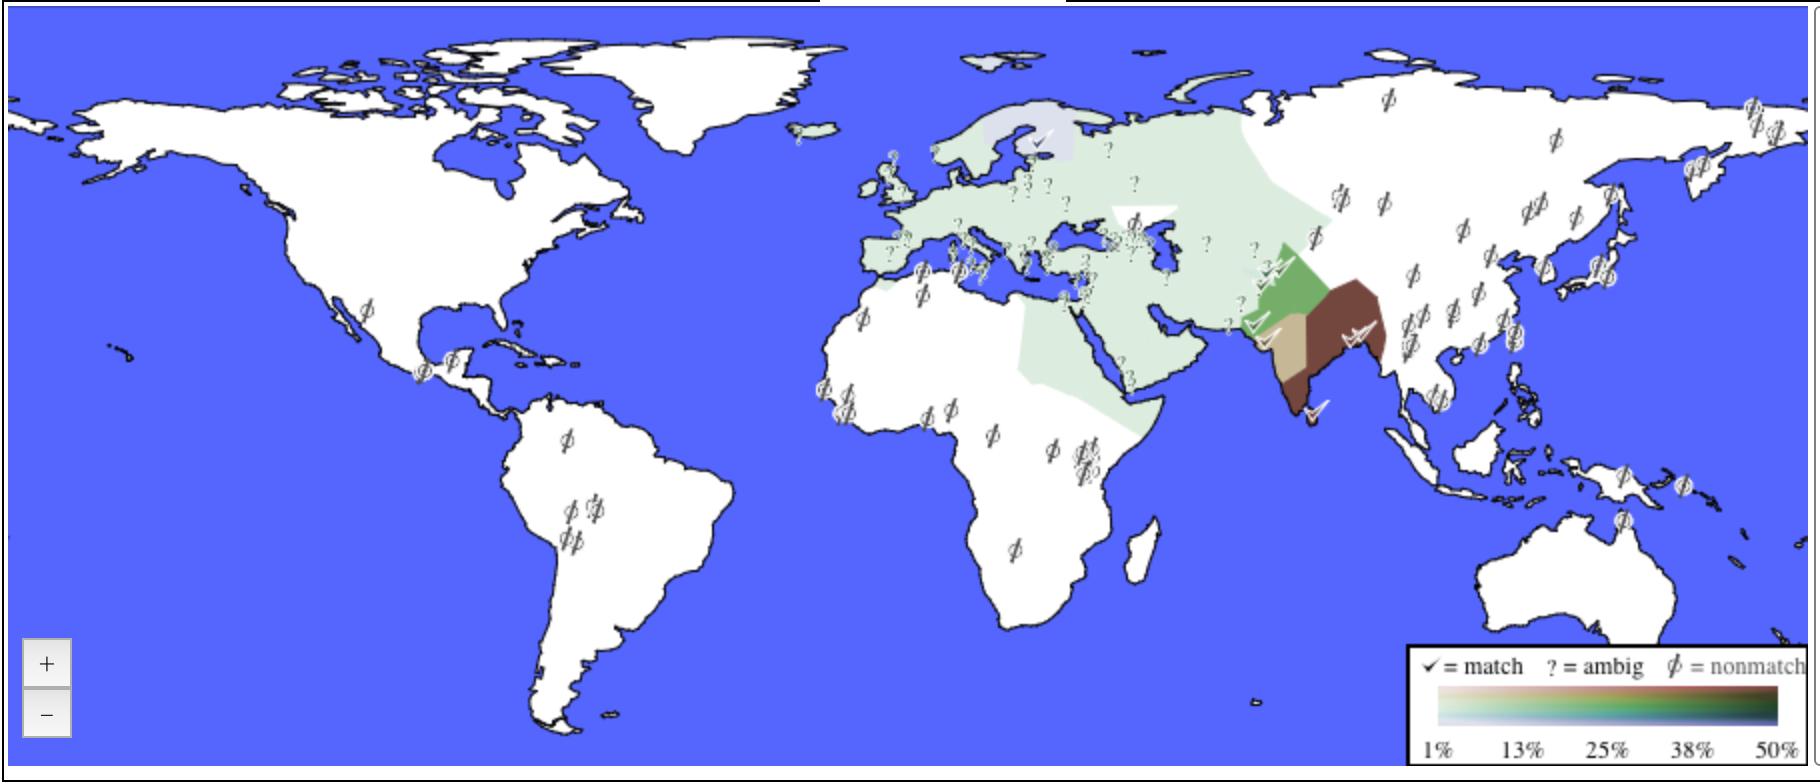
People with various ancestries matching about 5cM
segments on my genome.
Relative finder on 23and me also finds 3 more individuals with a
single segment each above their threshold, who share about 0.1% of
the DNA with me. These are likely to be distant (at least
3rd or 4th; may be as far as 10th)
cousins, but since they did not return my invitation, there is
little I know about them. Kate Popova with a 5cm (0.07%) match
is listed as a likely 10th cousin.
In addition, ancestry finder on 23andme finds short segments
(5–6 cM) which match with 11 individuals, only one of whom is
named (Ed Febus from Puerto Rico, with Spanish ancestry). Three others
have only United States as the known locations for their
grandparents. Of the rest, one provides no information about their
ancestry. One of the rest is from China, one from an Italian and
Spanish background, one from Denmark, and one from German and
Austrian background. There is one more whose known ancestry is
German, and one Polish. In principle, all these could be
distant cousins (say, 10th); or these short matches might
be due to other effects like memories of parallel selective
sweeps. The fact that two pairs (the Puerto Rican and part Polish;
and an United States with the Spanish Italian) among these 11
potential relatives match on roughly the same segments needs to be
considered in this.
Jim McMillan's DNA
cousins project also found three distant matches for me, all
about 5cM long. One of them goes by Ponto Hardbottle and is a
Maltese Christian and all of his known ancestry comes from there,
and he is reasonably sure that no different ethnicity or religion
contributed to his ancestry for at least half a millenium. Another,
a Dr. James Owston, has Northern European ancestry and has
extensive genealogical
records for about 200–300 years (and much older when it
touches European royalty). The third is Vladimir Markov, a Russian
with Eastern European and Central Asian ancestry; his mother is from
the Urals, and Dodecad analysis puts him close to the Pathans. But
23andme thresholds don't find them as sharing segments, though the
overall genetic similarity of one of the Owston cousins (Kristen
E. Owston), Valdimir Markov and Ponto Hardbottle is almost as close
as my first cousin (on father's side) once
removed, Roshni. This
overall genetic similarity, as discussed above, is actually a pretty
bad indicator of recent ancestry, but it is interesting that I am
much closer to them than my cousin.
Gedmatch finds about a dozen
people
with one 5 cM or longer match; the largest two being about 8 cM. These two
are could be as close as third cousins, but probably far more
distant, if, indeed, these are not false
positives. Most of these are based on a few hundred SNPs, which is really
borderline, but at least two of them are matches in high density regions. I
have not yet managed to contact them.
Family Tree DNA Family finder finds 9
matches with: S.M. (57 shared cM with longest 4), Jack Anderson (38 with 9),
Josette T (33 with 9), Jorell Vuthivcha-Mor (33 with 8), Alison Maree Humphries (33
with 8), Lauren Marge Humphries (29 with 8), Gadai Bulgac (27 with 8), Aram Ma (24
with 10), and Abdulla A Al-hassan (23 with 8). These are all rather far on
genealogical terms.
The HIR Search site finds 68
matches of 5cM or more: the largest match being of
8.9cM with 662 SNPs. I haven't studied these results in detail, yet.
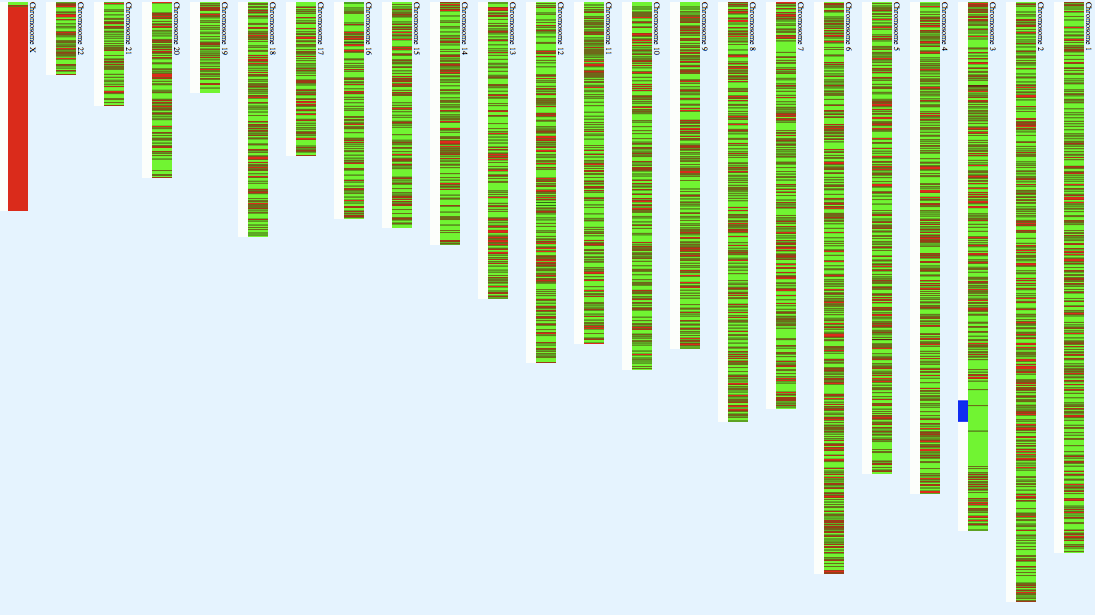
Map of the homozygosity on various chromosomes from the
gedmatch site. Green is homozygous
and red is not.
Most of us have two parents, four grandparents, and eight great
grandparents, but as we continue backward; this increase is arrested
because of inbreeding. Most of us belong to small population groups
that have exchanged grooms and brides amongs them. The homozygosity
of the DNA (both strands having the same base) can be used to
measure the size of this effective population of intermarrying
individuals that leave many descendants. A publicly available
webpage
allows this analysis, and my 23andme results contain large runs of
homozygosity. On Chromosome 3, I have for example, runs of length
8.38 (2017 calls), 9.05 (856 calls), 12.46 (2997 calls) Megabases
and many smaller ones. All total, I have 44 runs of more than 200
homozygous basecalls, totalling about 69.539% homozygosity in the
autosomes. In comparison, there are only two short stretches of
heterozygosity greater than 20 long, totalling about 29.66%
heterozygosity in the autosomes. Such a pattern (presence of
multiple 10–12 Mb runs) is typical of South and West Asian
populations,
and shows
recent (about 150 years) parental relatedness.
The gedmatch site performs
a more detailed analysis, and reports that the largest single-block
was about 1.439 cM (946 SNPs) and the total was about 2.162 cM (1568
SNPs in blocks more than 500 SNPs in size). These numbers
are very small, and are probably both in the same region on Chromosome
3 (thus making a selective sweep an attractive explanation) and I would
expect this would mean that even if the homozygosity is due to
consanguinity, the last common ancestor of my parents was probably
more than 7 or 8 generations back.
Selection
One way one gets an effective population size much smaller than the
census size is when rapid selection weeds out the unfit. Rapid selection,
however, leaves traces in the genome of large regions with low
diversity: the size of these regions is limited only by the efficacy of
recombination maintaining diversity as the selection proceeds, and
decreases with time due to intermingling of people who faced different
selection pressure. These selection pressures seem to have been different
in different regions of the world, and have been studied. Analyzing my genome as an
European one, I find that of the 57 locii
under rapid selection (with
20 favoring the ancestral allele and 37 the derived one) for which
my genotype at a linked locus is known, I am heterozygous at 16, and am
homozygous for the derived allele in another 20. Of the 41 homzozygous locii,
I carry the selected allele in 23 (16 ancestral and 7 derived) of them.
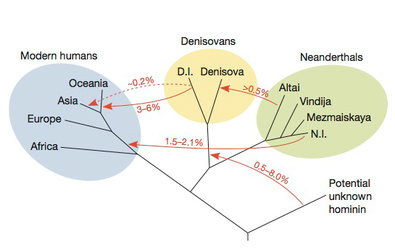
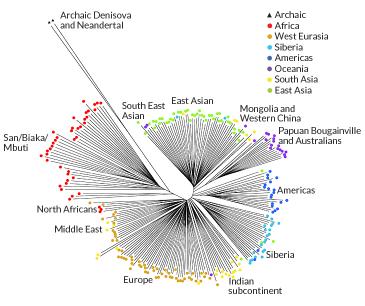
A study reported on in the New York Times in
December 2013 estimated percentages
of genetic transfer between
human species. The split between modern humans and
the
Denisovan/Neanderthals is estimated to have been about 600 kiloyears
back, and
a study from
2012 had found the date of Neanderthal admixture
in humans was
probably between 47–65 kiloyears ago.
Though modern humans are predominantly the descendants of a group
of humans that moved out of Africa some 100,000 years back, there is
increasing evidence that they did interbreed with previous
‘humans’ that have been coming out of Africa starting
about a million years ago. These previous humans, like the
Neanderthals in Europe, and the ones who left the famous fossils
like Java man and Peking man left paleolithic tools, and belong to a
variety of species and subspecies in the homo genus. Studies of the
variation at different locii on the human genome; and especially the
study of Y- and mt-DNA shows that the genetic component of these
other groups is negligible in every modern human population. In fact,
some regions of the genome seem completely free of Neanderthal
admixture, suggesting, for example, males born of Neanderthal mothers
and modern human fathers were infertile. Nevertheless, there are
tantalizing little clues
of these early interbreeding, though the total genetic contribution of these
earlier humans probably does not exceed about 10% in any extant human.
On the other hand, some estimate that as large as 20% of the Neandethal
genome survives in some or the other human: giving humans better adapted
alleles for keratin, as well as diseases like diabetes and Crohn's
disease.
Of the most well established of these mixtures is the evidence of
Neanderthal
component in non-African populations
and Denisovan
component in some Melanesians. The evidence is, however, statistical
and much further work will be needed to identify precise locations
that can be associated with such ancestry. I do not,
however, have the
telltale
Archaic/Neanderthal marker B006 on my X chromosome; instead I have
the cosmopolitan B001 which is found in 12.5% Africans and 35.8%
non-Africans. According to the online analysis presented by the Stanford site, out of the 42
differring between the African human populations and the Neanderthals,
I am heterozygous at 12 of them, and
homozygous for the non-African allele at one more. I can't quite
reproduce this when I compare the my data to the published Neanderthal/Denisovan
data:
I find a region on Chromosome 6 comprising 8 SNPs where
I am heterozygous for the Neanderthal allele (the Neanderthal is derived in this
region), and another on chromosome 10 comprising 5 SNPs where I match
a non-African allele (4/5 match the Neanderthal, 4/4 sequenced in Denisovans,
including the non-match to Neanderthal, match the Denisovan). Denisovan
alleles being common all over, and especially in regions around Southern
China (see figure 1E of the recent paper on this issue),
this is not unexpected. 23andme finds 222 out of 2872 variants tested to be
from Neanderthals, from which they currently estimate that less than about
2% of my genome is of
Neanderthal origin, where the average South Asian has 2.5%. According to
them, this puts me at the 7th percentile among their customers.
Of the far more diffuse evidence from the earlier studies, which were
done before the Neanderthal genome was sequenced, I am heterozygous for the
MAPT locus with one copy from the H2 clade, which had been claimed
to be associated with the Neanderthals; but the explicit sequence of
the Neandarthal
genome does not confirm the Neandarthal origin of this.